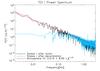
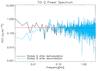
Fig. 6
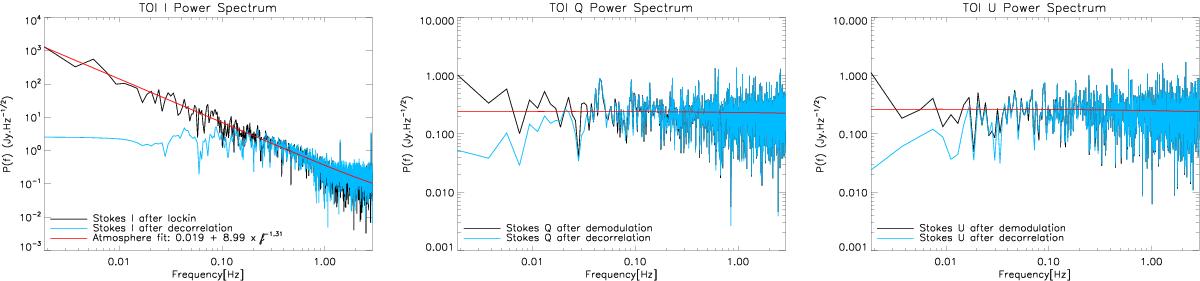
From left to right: power spectra of the Stokes I, Q, and U pure TOIs (black) after applying the lock-in procedure to the raw data in Fig. 4. A bandpass filter ([0.01,2.9] Hz) was applied to reject any high-frequency noise and half wave plate systematic signal (HWPSS) residual at the fourth harmonics. In blue we also show the power spectra after applying the decorrelation procedure to the demodulated data. See Sect. 4.4 for details.
Current usage metrics show cumulative count of Article Views (full-text article views including HTML views, PDF and ePub downloads, according to the available data) and Abstracts Views on Vision4Press platform.
Data correspond to usage on the plateform after 2015. The current usage metrics is available 48-96 hours after online publication and is updated daily on week days.
Initial download of the metrics may take a while.