Fig. 3
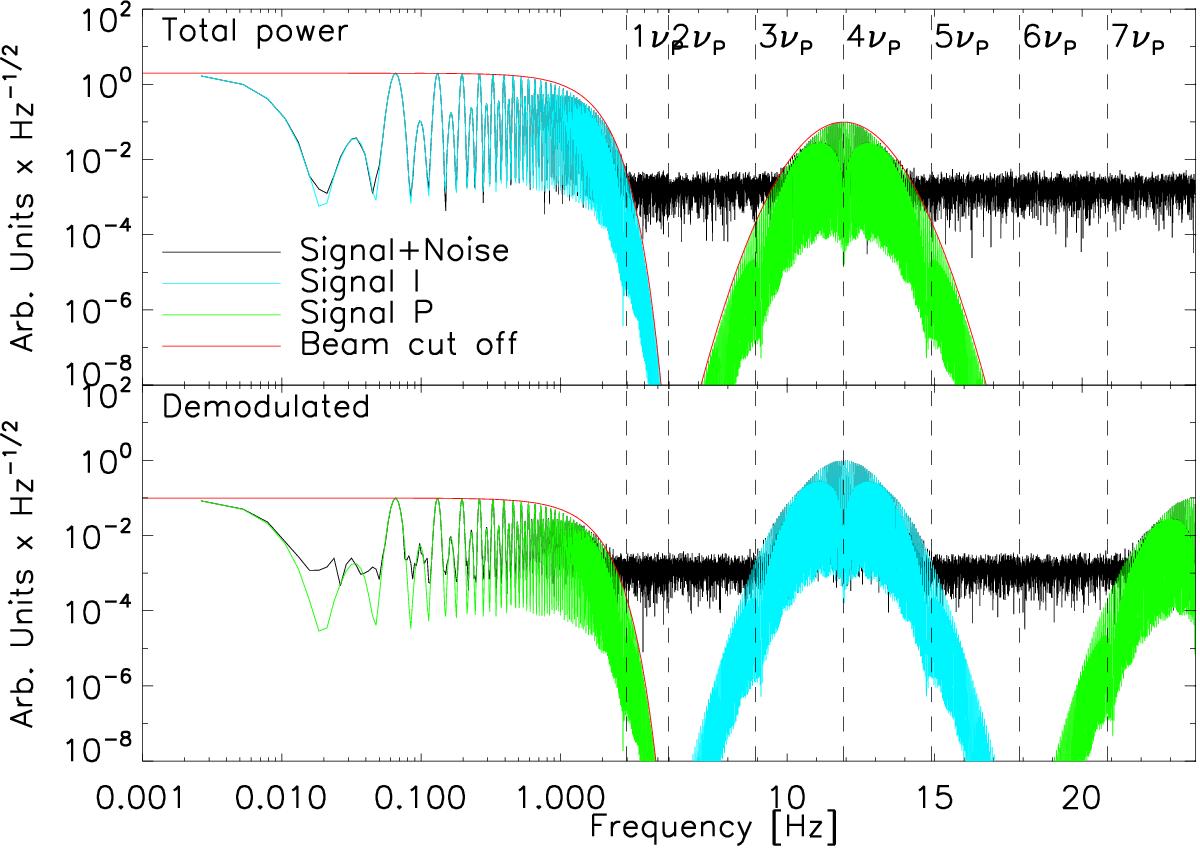
Top panel: power spectrum of a simulated TOI for a polarized point source observed under a raster scan with a continuously rotating HWP facing a polarization analyzer. The raw signal plus noise TOI (black) has its total intensity content highlighted in cyan and the polarized content in green. The polarization signal band is centered on the fourth HWP harmonics while the intensity signal band lays at lower frequencies. Bottom panel: TOI after demodulation (see Sect. 4.1). We observe that half of its Stokes Q content has been put at low frequency while the Stokes I content and the remaining polarized contents are shifted at frequencies higher than the signal band.
Current usage metrics show cumulative count of Article Views (full-text article views including HTML views, PDF and ePub downloads, according to the available data) and Abstracts Views on Vision4Press platform.
Data correspond to usage on the plateform after 2015. The current usage metrics is available 48-96 hours after online publication and is updated daily on week days.
Initial download of the metrics may take a while.