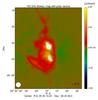
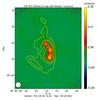
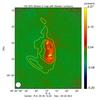
Fig. 14
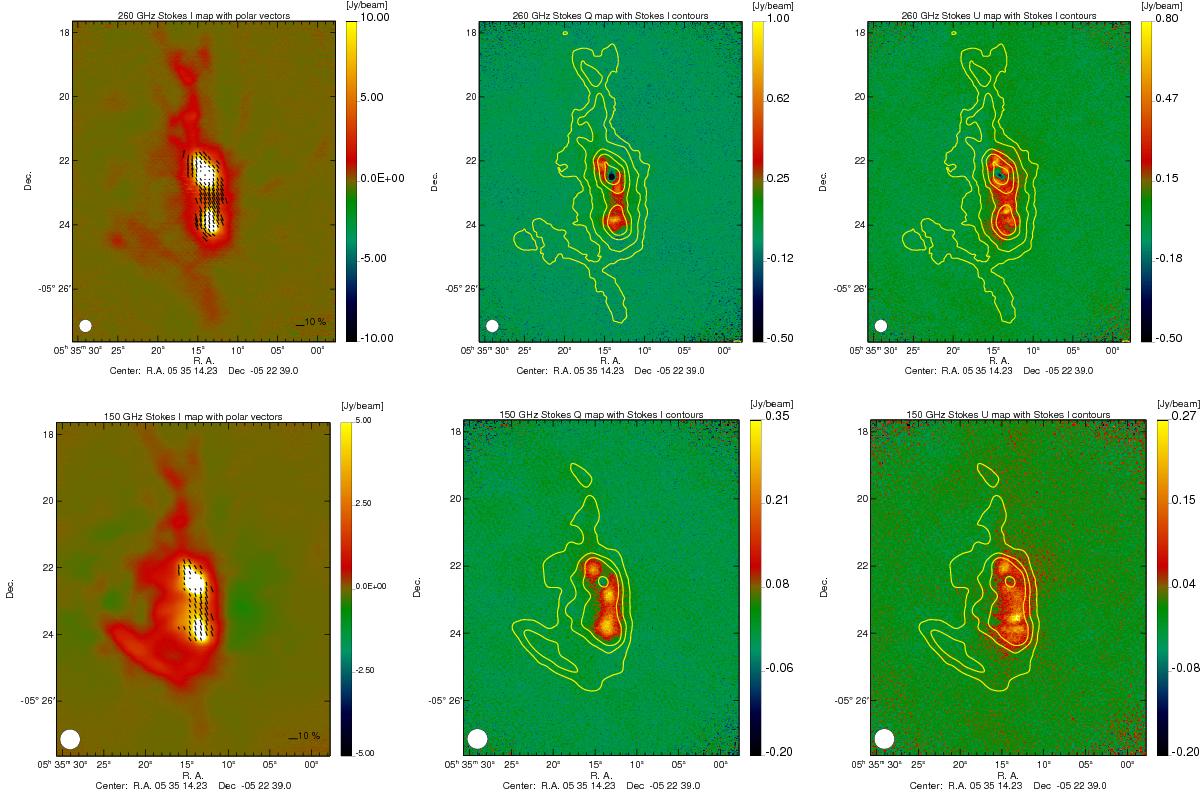
NIKA Stokes I, Q, and U maps of Orion OMC-1 at 260 GHz (top) and 150 GHz (bottom). The intensity contours over-plotted in the Q and U maps correspond to (0.3, 1, 3, 6, 15, and 48) Jy/beam at 260 GHz and (0.3, 1, 2, 10, 14) Jy/beam at 150 GHz. Polarization vectors are plotted in black in the intensity image when I > 0 and P > 2σP.
Current usage metrics show cumulative count of Article Views (full-text article views including HTML views, PDF and ePub downloads, according to the available data) and Abstracts Views on Vision4Press platform.
Data correspond to usage on the plateform after 2015. The current usage metrics is available 48-96 hours after online publication and is updated daily on week days.
Initial download of the metrics may take a while.