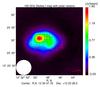
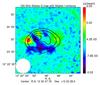
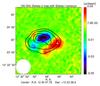
Fig. 13
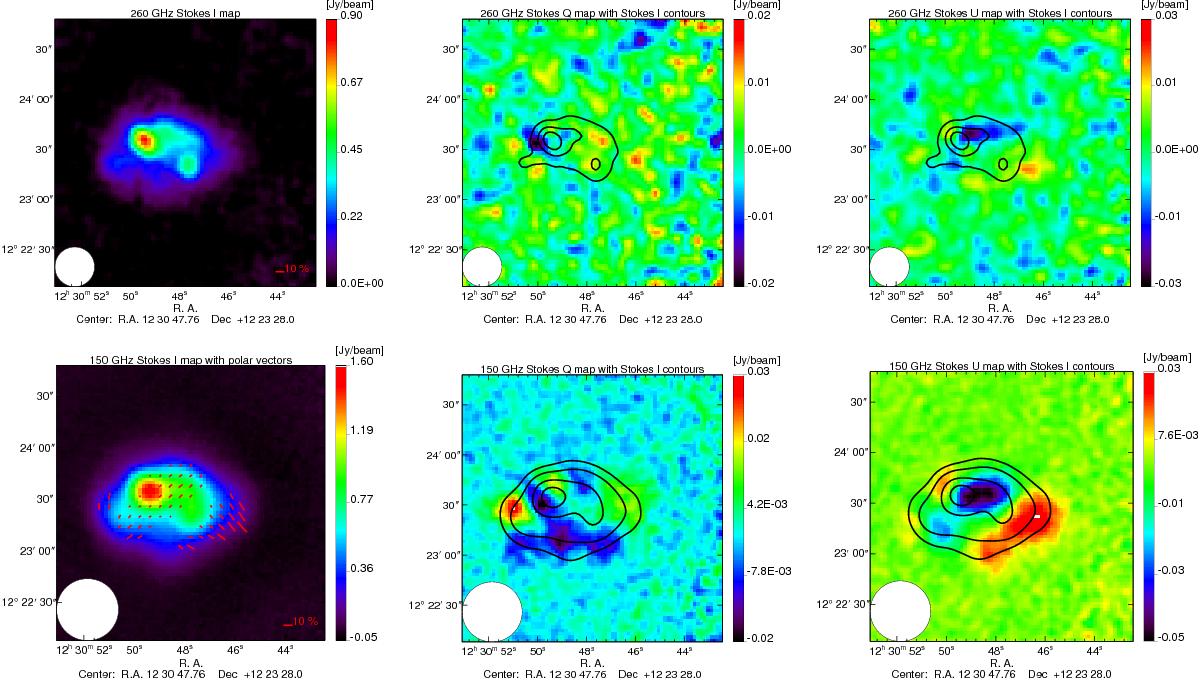
NIKA M 87 Stokes I, Q, and U maps at 260 GHz (top) and 150 GHz (bottom). For display purposes, at 260 GHz, the Q and U maps are smoothed with a Gaussian filter of 6 arcsec and the I map of 4 arcsec. At 150 GHz the Q and U maps are also smoothed to 4 arcsec, while the I map is not smoothed. The contours in Q and U represent the intensity map for each frequency, starting from 0.2 Jy/beam with steps of 0.2 Jy/beam. Polarization vectors are plotted in red in the intensity image when I > 0 and P > 2σP.
Current usage metrics show cumulative count of Article Views (full-text article views including HTML views, PDF and ePub downloads, according to the available data) and Abstracts Views on Vision4Press platform.
Data correspond to usage on the plateform after 2015. The current usage metrics is available 48-96 hours after online publication and is updated daily on week days.
Initial download of the metrics may take a while.