Fig. 2
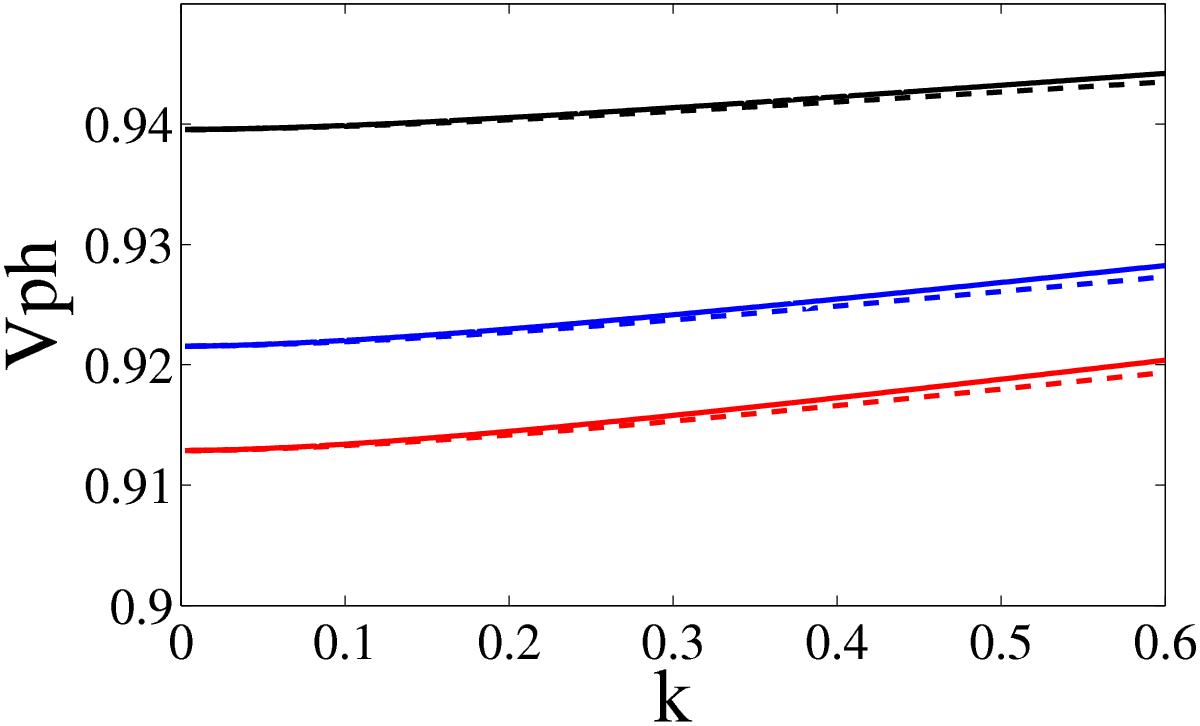
Dispersion curves for the torsional wave for various density contrasts. The equilibrium twist ![]() is equal to zero and the equilibrium rotation ℛ is equal to 0.1 for all three sets. The black curves are for a density contrast of 4.6, the blue curves for a density contrast of 5.6, and the red curves for a density contrast of 5.9. The solid curves are obtained numerically from Eq. (14), while the dashed curves are plotted from the explicit expression of Eq. (22). The phase speeds are normalised by the internal Alfvén speed.
is equal to zero and the equilibrium rotation ℛ is equal to 0.1 for all three sets. The black curves are for a density contrast of 4.6, the blue curves for a density contrast of 5.6, and the red curves for a density contrast of 5.9. The solid curves are obtained numerically from Eq. (14), while the dashed curves are plotted from the explicit expression of Eq. (22). The phase speeds are normalised by the internal Alfvén speed.
Current usage metrics show cumulative count of Article Views (full-text article views including HTML views, PDF and ePub downloads, according to the available data) and Abstracts Views on Vision4Press platform.
Data correspond to usage on the plateform after 2015. The current usage metrics is available 48-96 hours after online publication and is updated daily on week days.
Initial download of the metrics may take a while.