Fig. 8
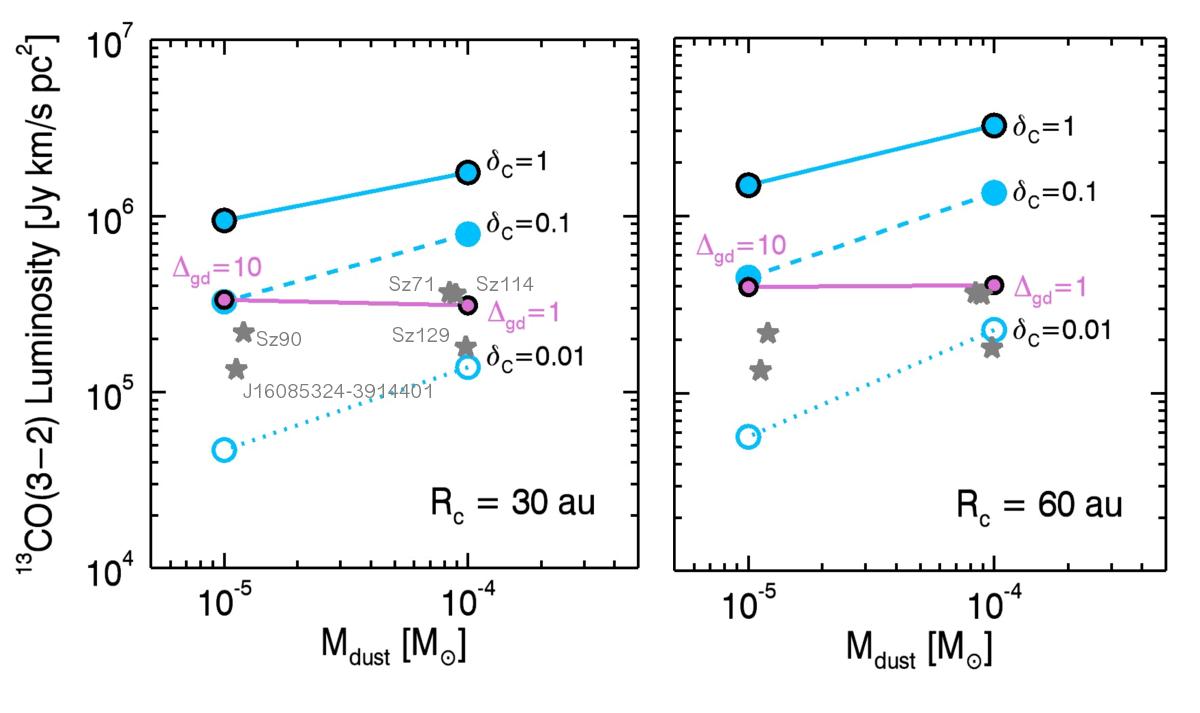
13CO (J = 3−2) luminosity as a function of dust mass. Light blue circles present the simulated line luminosities with different levels of carbon depletion: no depletion (δC = 1, black contoured circles), depletion by a factor of 10 (δC = 0.1, filled light blue circles), and depletion by two orders of magnitude (δC = 0.01, light blue empty circles). Purple circles present the simulated line luminosities obtained without carbon depletion, fixing the gas mass Mgas = 10-4M⊙ and increasing the dust mass to Mdust = 10-5,10-4M⊙, accordingly with gas-to-dust ratios Δgd = 10, 1. A subsample of six Lupus sources is shown with gray stars. Models run with Rc = 30 au and with Rc = 60 au are shown in the left and right panels, respectively.
Current usage metrics show cumulative count of Article Views (full-text article views including HTML views, PDF and ePub downloads, according to the available data) and Abstracts Views on Vision4Press platform.
Data correspond to usage on the plateform after 2015. The current usage metrics is available 48-96 hours after online publication and is updated daily on week days.
Initial download of the metrics may take a while.