Fig. 6
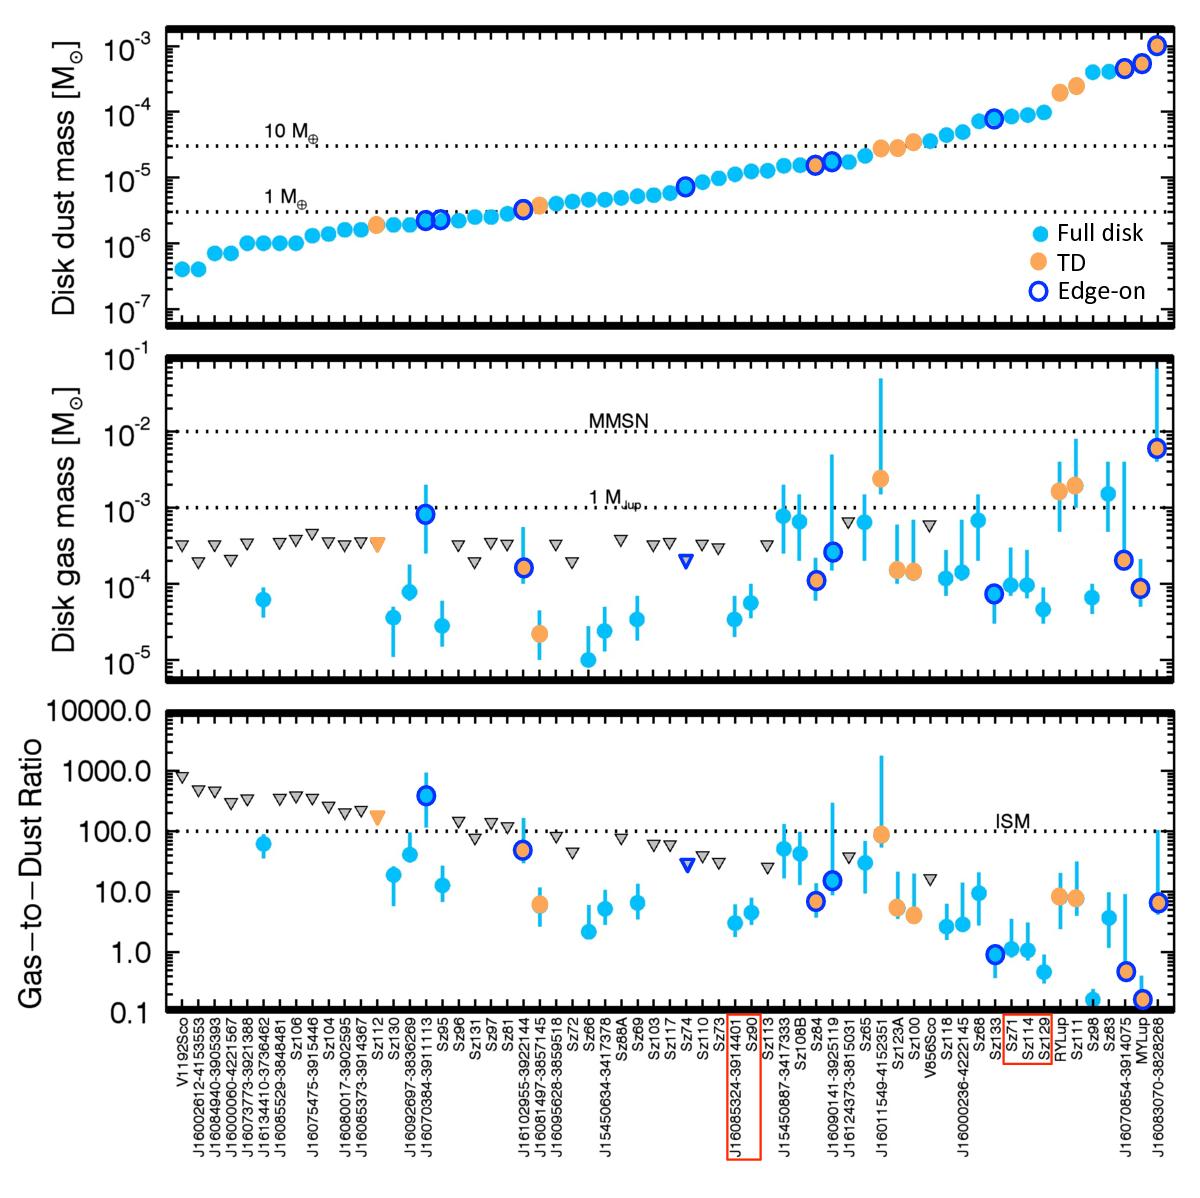
Disk dust masses (upper panel), gas masses (middle panel), and gas-to-dust ratios (lower panels) for all the sources detected in the continuum. Gas non-detections are shown with gray triangles, while all detections are presented as filled circles. Objects that are classified as transitional disks (TD) are shown in orange, and edge-on disks are circled in blue. Red rectangles show the subsample of disks discussed in Sect. 5.2.1.
Current usage metrics show cumulative count of Article Views (full-text article views including HTML views, PDF and ePub downloads, according to the available data) and Abstracts Views on Vision4Press platform.
Data correspond to usage on the plateform after 2015. The current usage metrics is available 48-96 hours after online publication and is updated daily on week days.
Initial download of the metrics may take a while.