Fig. 5
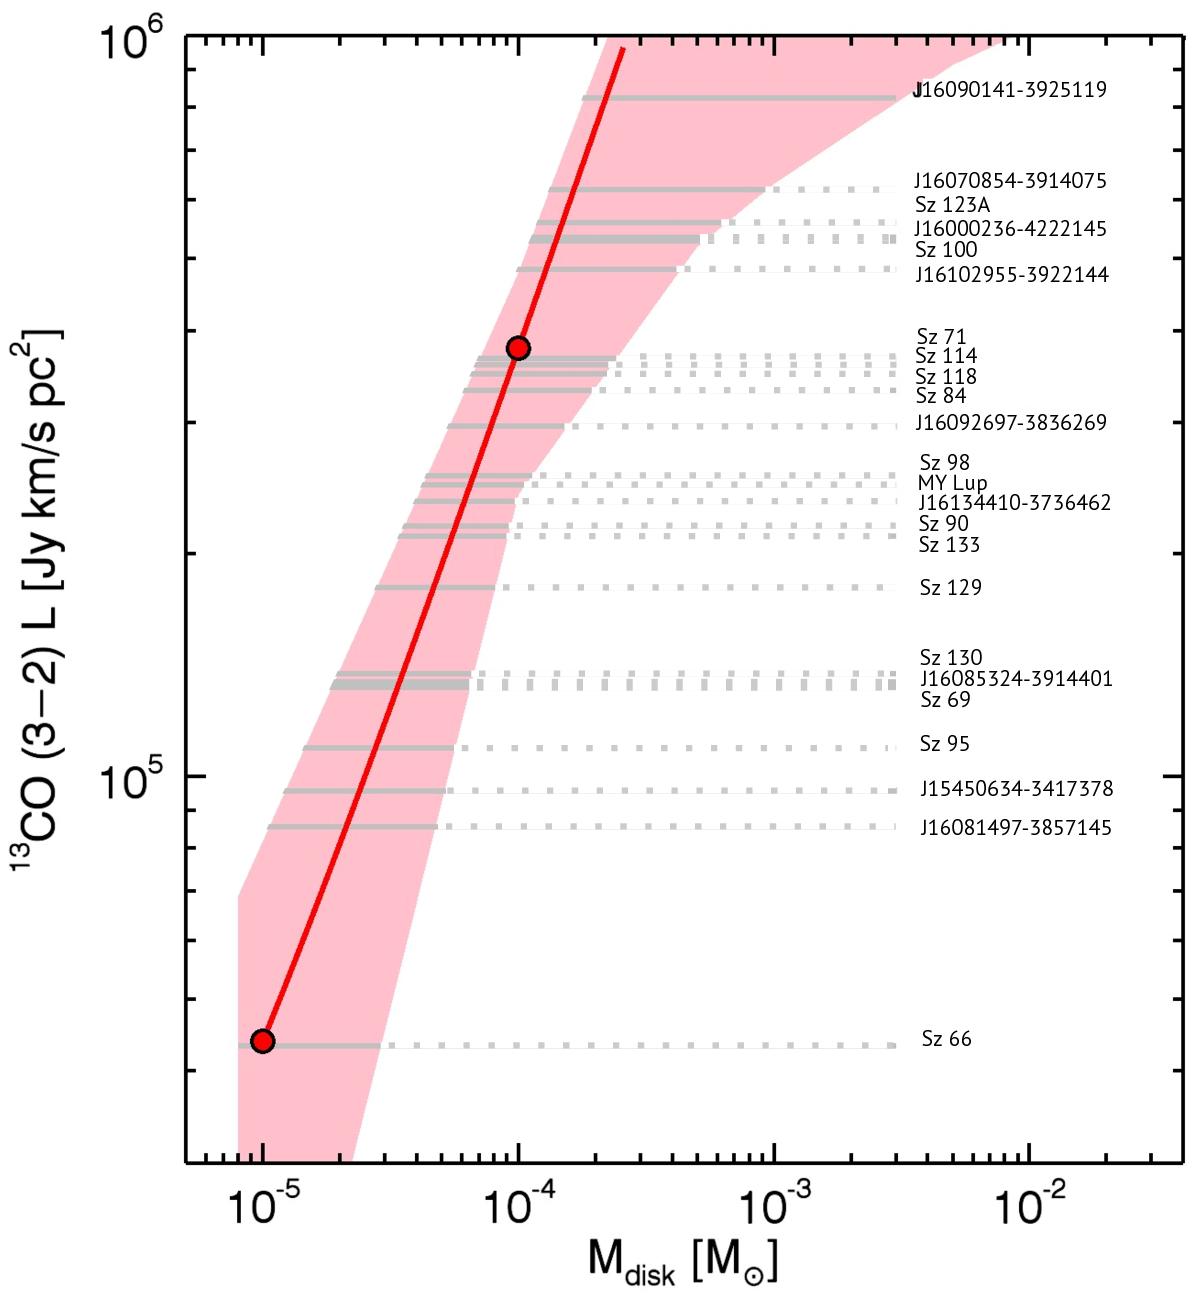
Zoom of Fig. 4 top: medians of the 13CO (3–2) simulated line luminosities for different mass bins, presented with red dots in the region where the luminosity dependence on mass is linear (see Eq. (3)). The red line shows the fit function of the line luminosity as a function of disk mass. The 13CO-only detections are shown with gray dashed lines. The pink band shows the maximum and minimum simulated line luminosities.
Current usage metrics show cumulative count of Article Views (full-text article views including HTML views, PDF and ePub downloads, according to the available data) and Abstracts Views on Vision4Press platform.
Data correspond to usage on the plateform after 2015. The current usage metrics is available 48-96 hours after online publication and is updated daily on week days.
Initial download of the metrics may take a while.