Free Access
Fig. 2
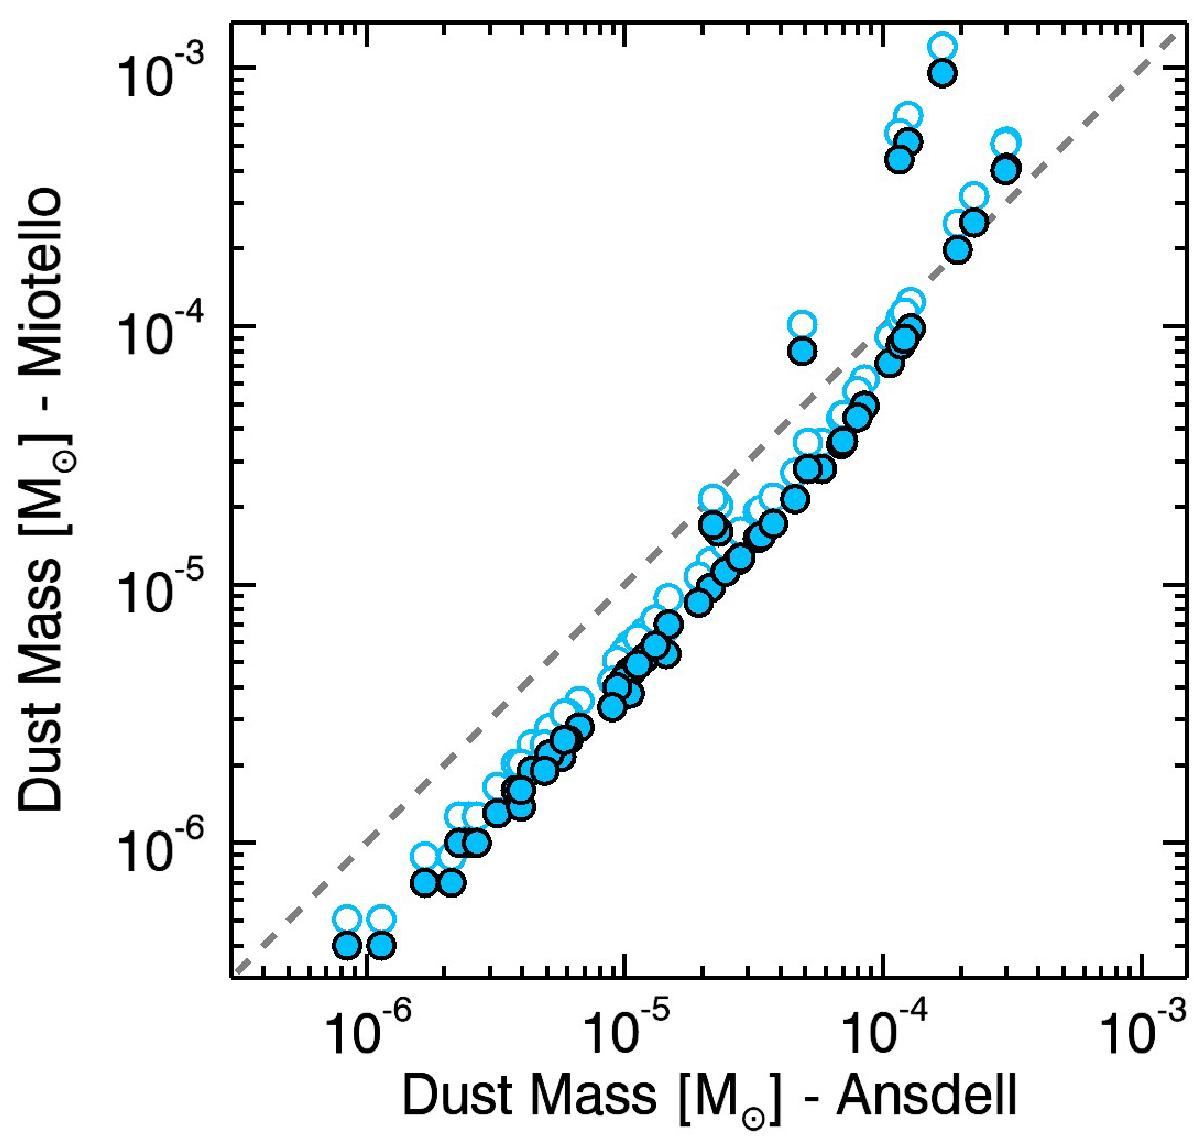
Disk dust masses derived in this work compared with the dust masses obtained by Ansdell et al. (2016). Full symbols show the current model results. Empty circles present mass estimates corrected for the dust opacity difference at 340 GHz between the two studies.
Current usage metrics show cumulative count of Article Views (full-text article views including HTML views, PDF and ePub downloads, according to the available data) and Abstracts Views on Vision4Press platform.
Data correspond to usage on the plateform after 2015. The current usage metrics is available 48-96 hours after online publication and is updated daily on week days.
Initial download of the metrics may take a while.