Fig. 1
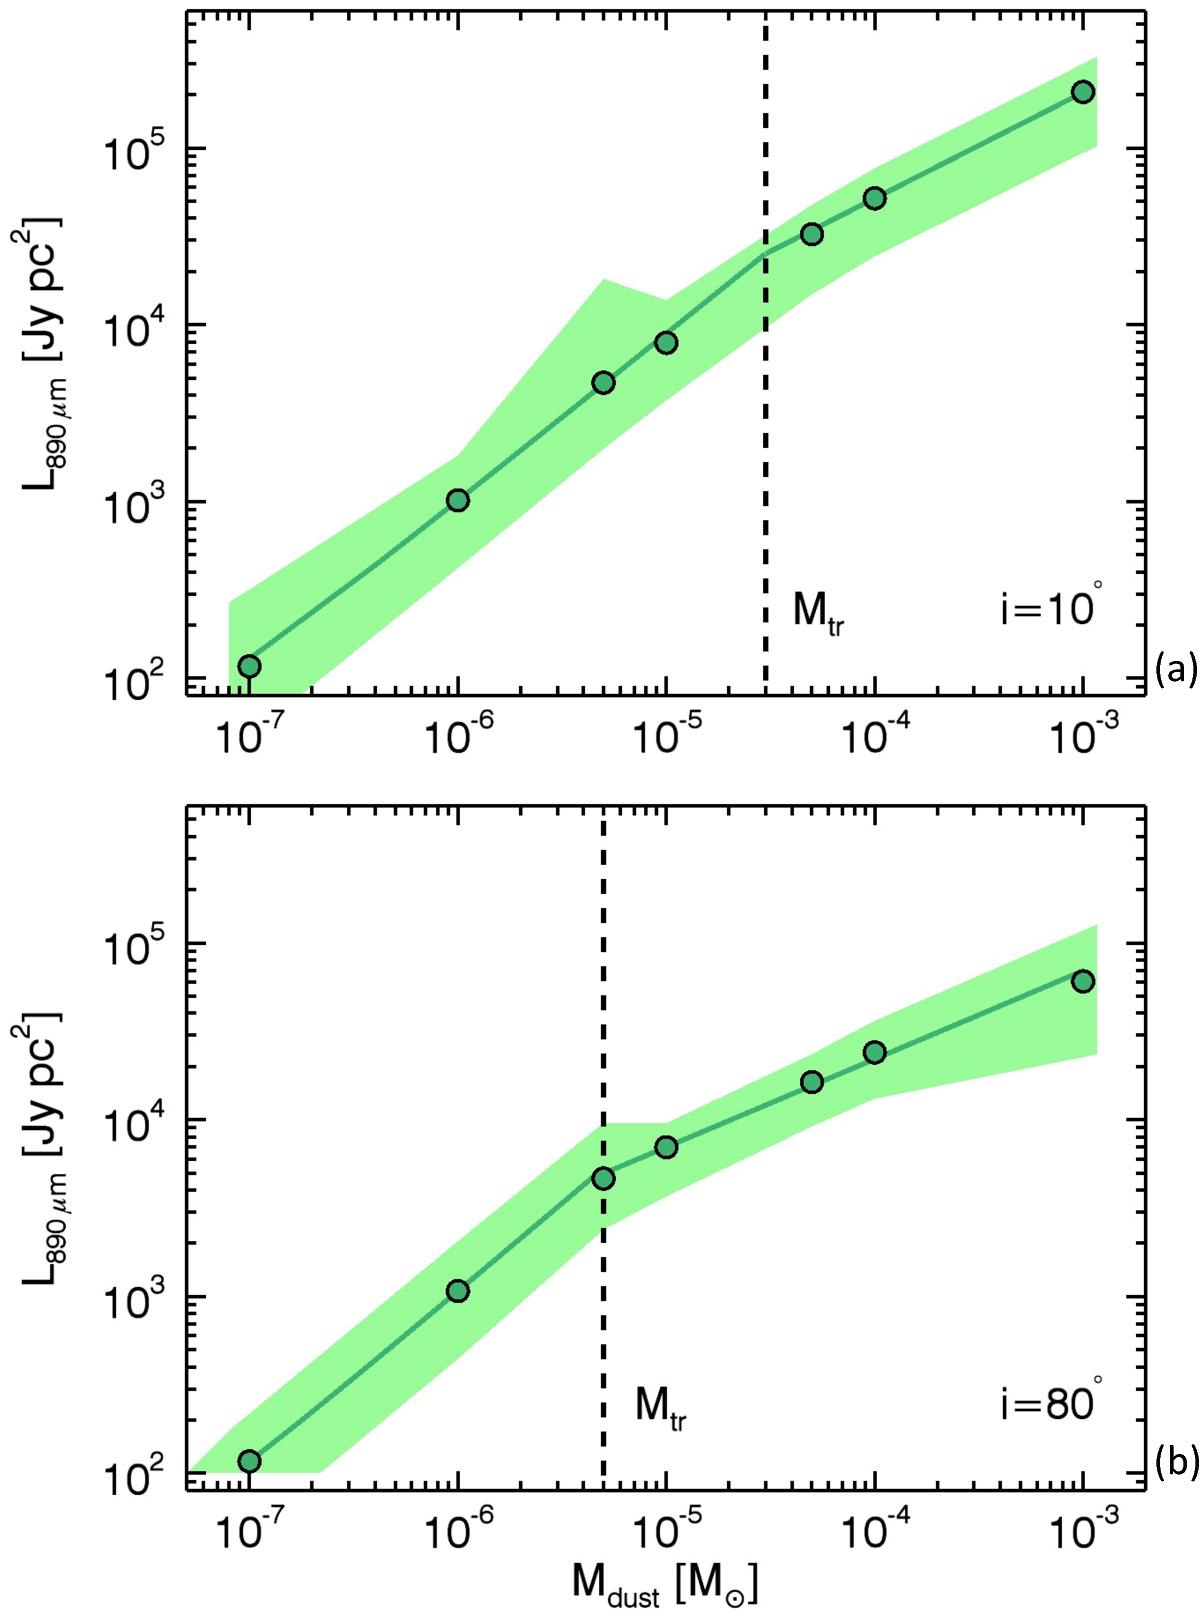
Medians of the simulated T Tauri continuum luminosities at 890 μm for different mass bins, presented by the green dots for disk inclinations of 10° and 80° in panels a) and b), respectively. The solid lines show the fit function of the 890 μm continuum luminosity as a function of the disk mass (see Eq. (2)). The dotted black lines present the transition mass between the two dependencies of the luminosity on the mass expressed in Eq. (2). The colored bands show the maximum and minimum simulated continuum luminosities for the different mass bins.
Current usage metrics show cumulative count of Article Views (full-text article views including HTML views, PDF and ePub downloads, according to the available data) and Abstracts Views on Vision4Press platform.
Data correspond to usage on the plateform after 2015. The current usage metrics is available 48-96 hours after online publication and is updated daily on week days.
Initial download of the metrics may take a while.