Fig. 8
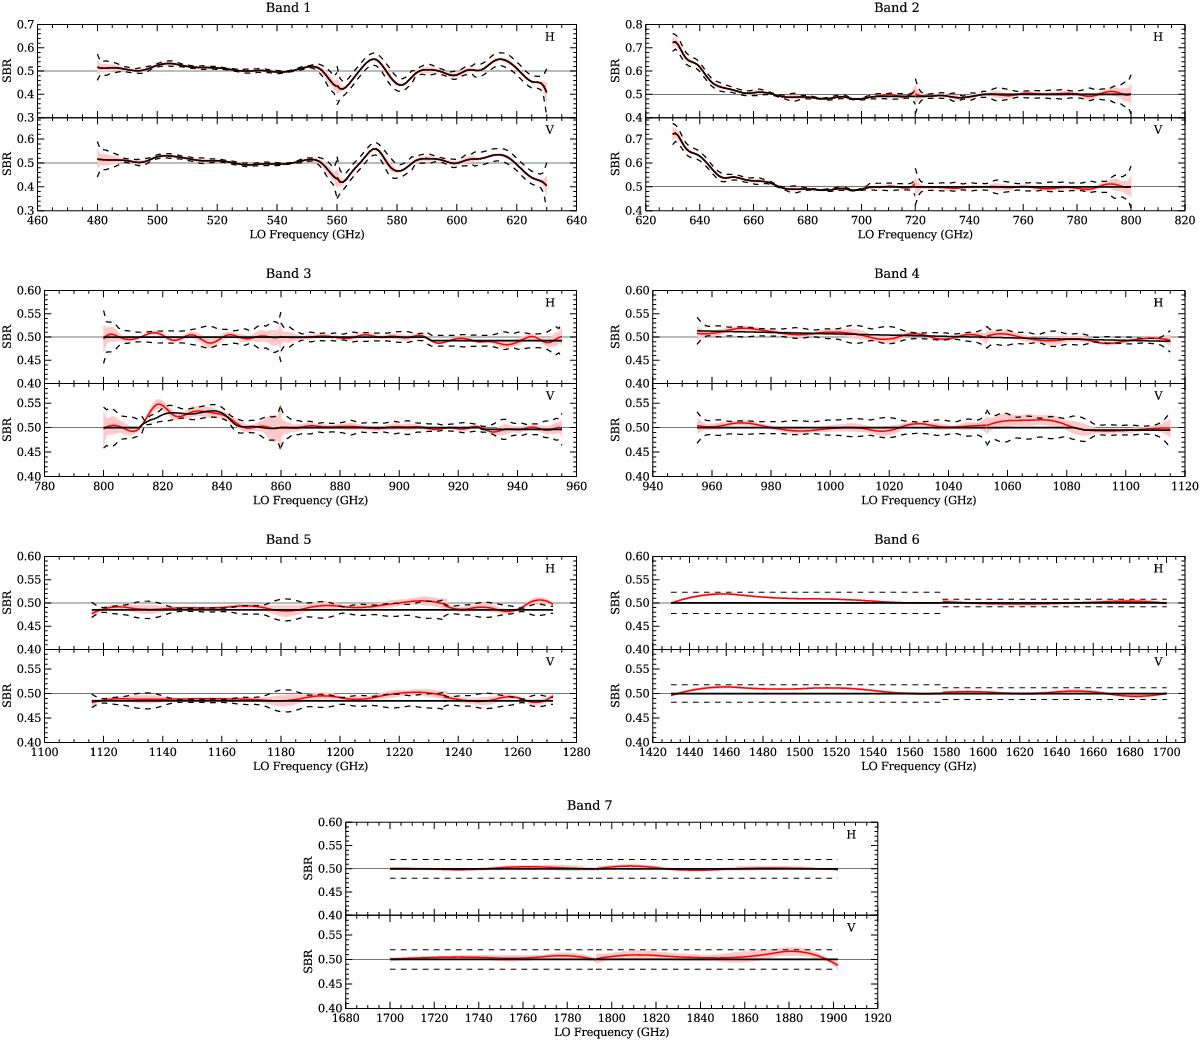
Sideband ratio Gusb (see Sect. 2) as a function of local oscillator frequency for all 7 HIFI bands. The red lines show the result of our fit with the 1σ confidence region shown as a pink envelope. The black lines represent the finally adopted values in the calibration tables. The dashed lines indicate the 1σ uncertainty. Each panel contains 2 sub-panels; the upper panel shows the H polarisation and the lower panel indicates V polarisation. In those panels we no longer distinguish between the a and b parts of the mixer band.
Current usage metrics show cumulative count of Article Views (full-text article views including HTML views, PDF and ePub downloads, according to the available data) and Abstracts Views on Vision4Press platform.
Data correspond to usage on the plateform after 2015. The current usage metrics is available 48-96 hours after online publication and is updated daily on week days.
Initial download of the metrics may take a while.