Fig. 3
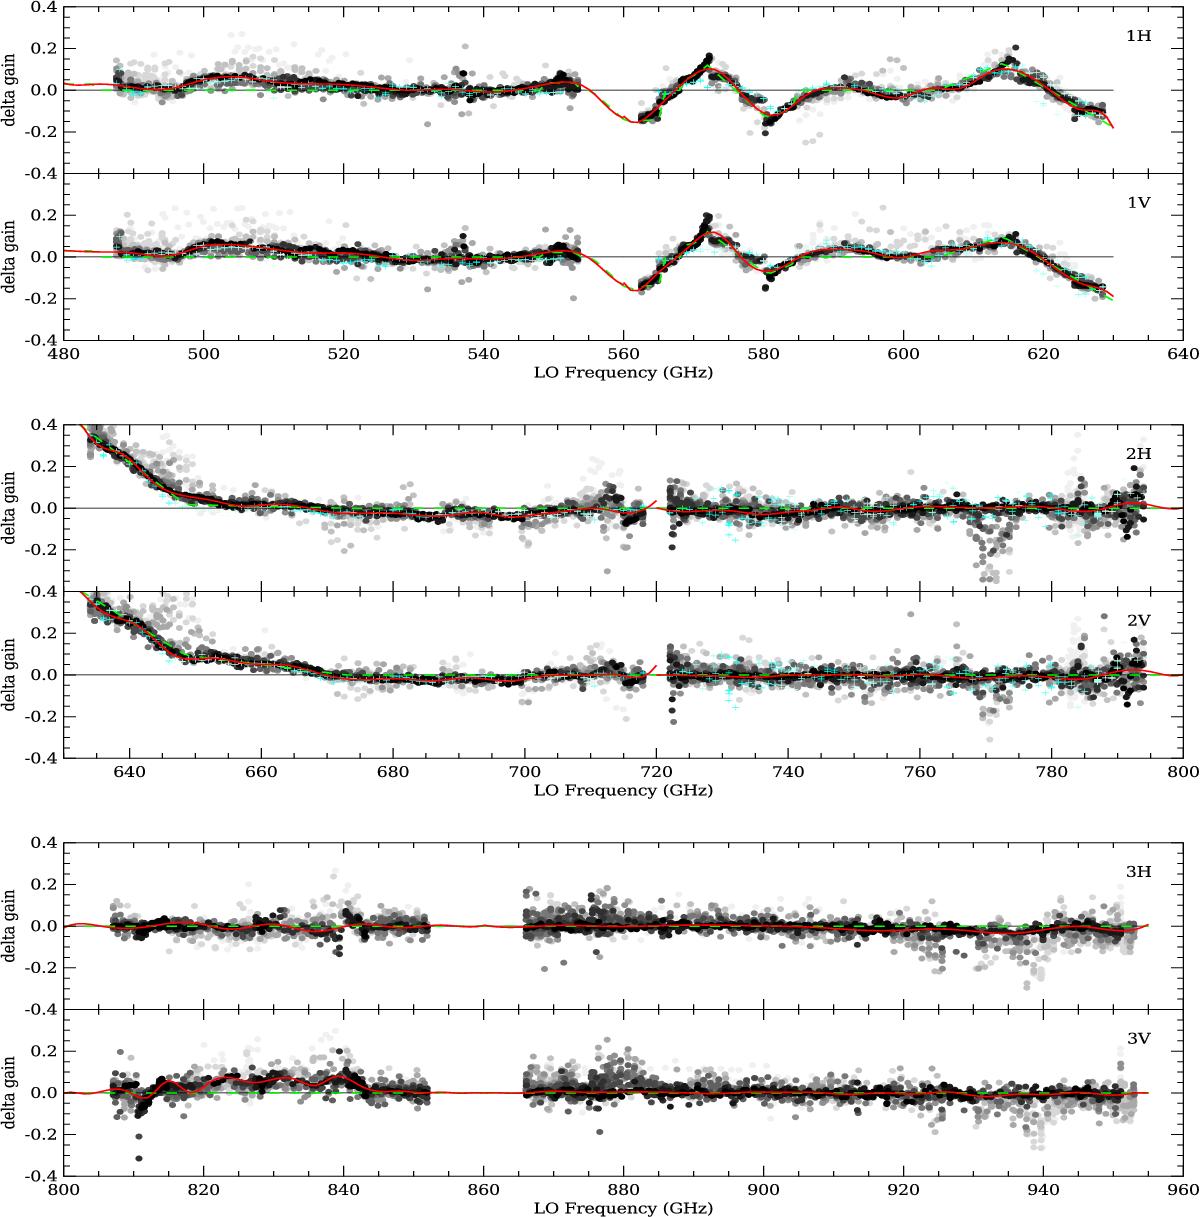
Delta gain derivation results for bands 1–3. Dots correspond to individual gain measurements; lighter-coloured dots have a lower level of confidence, and therefore a lesser weight in the fit. Black dots originate from in-orbit observations (Sect. 3.2), while mint crosses originate from laboratory methanol data (Sect. 3.1). The red line shows a smoothing cubic spline through the points. The green dashed line shows the prior gain. The black line represents a balanced mixer, i.e. delta gain = 0.
Current usage metrics show cumulative count of Article Views (full-text article views including HTML views, PDF and ePub downloads, according to the available data) and Abstracts Views on Vision4Press platform.
Data correspond to usage on the plateform after 2015. The current usage metrics is available 48-96 hours after online publication and is updated daily on week days.
Initial download of the metrics may take a while.