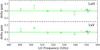
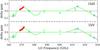
Fig. 2
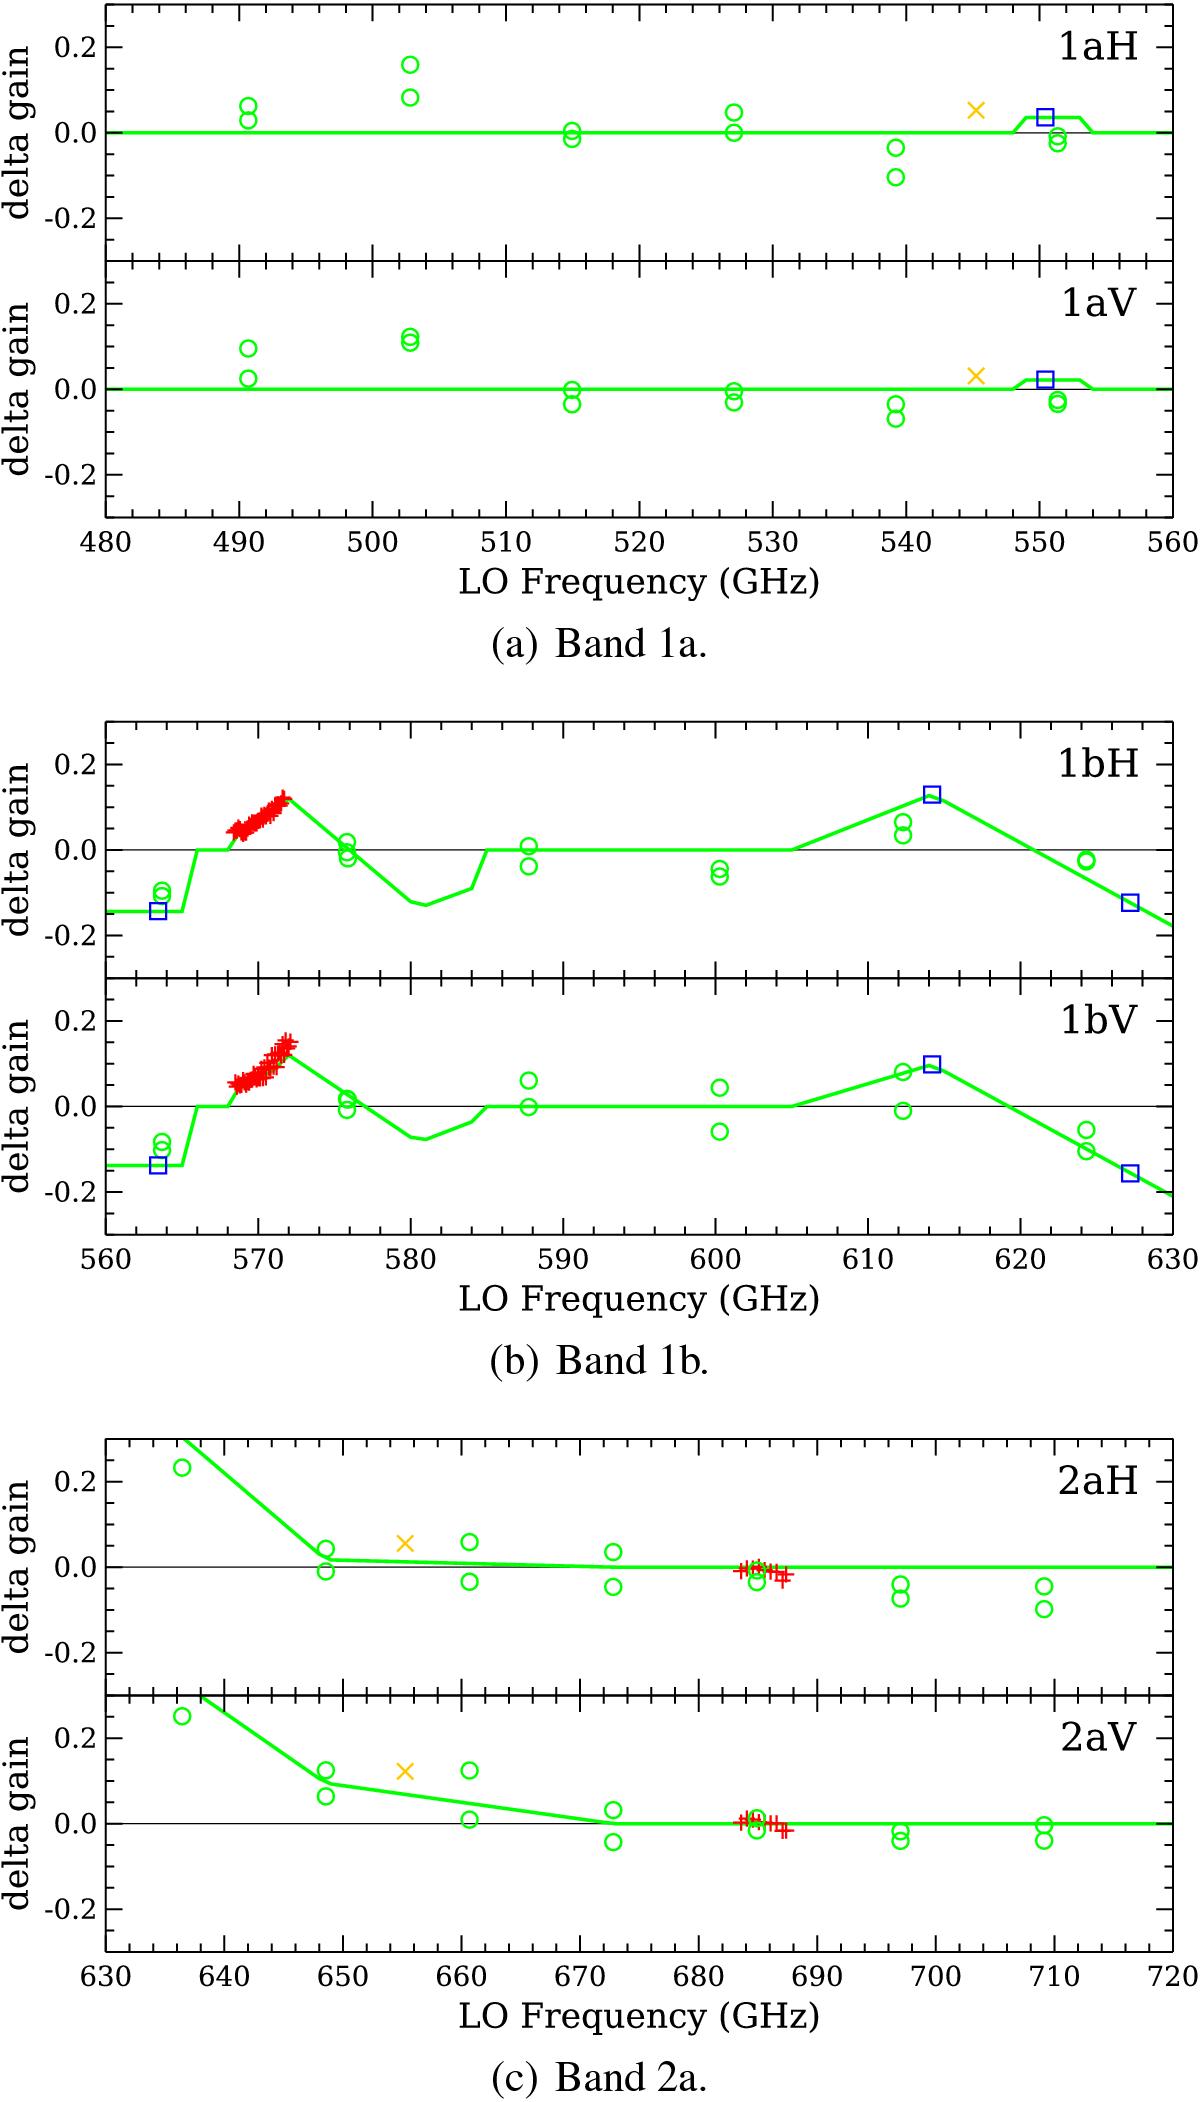
Prior gains used in the deconvolution of data from the bands 1a, 1b, and 2a. The delta gain derived from laboratory measurements of saturated lines of ![]() CO,
CO, ![]() CO, H
CO, H![]() O, and OCS are shown in orange crosses, red crosses, blue squares, and green circles, respectively. The prior gain over the applicable frequency ranges is shown as a green line.
O, and OCS are shown in orange crosses, red crosses, blue squares, and green circles, respectively. The prior gain over the applicable frequency ranges is shown as a green line.
Current usage metrics show cumulative count of Article Views (full-text article views including HTML views, PDF and ePub downloads, according to the available data) and Abstracts Views on Vision4Press platform.
Data correspond to usage on the plateform after 2015. The current usage metrics is available 48-96 hours after online publication and is updated daily on week days.
Initial download of the metrics may take a while.