Fig. 1
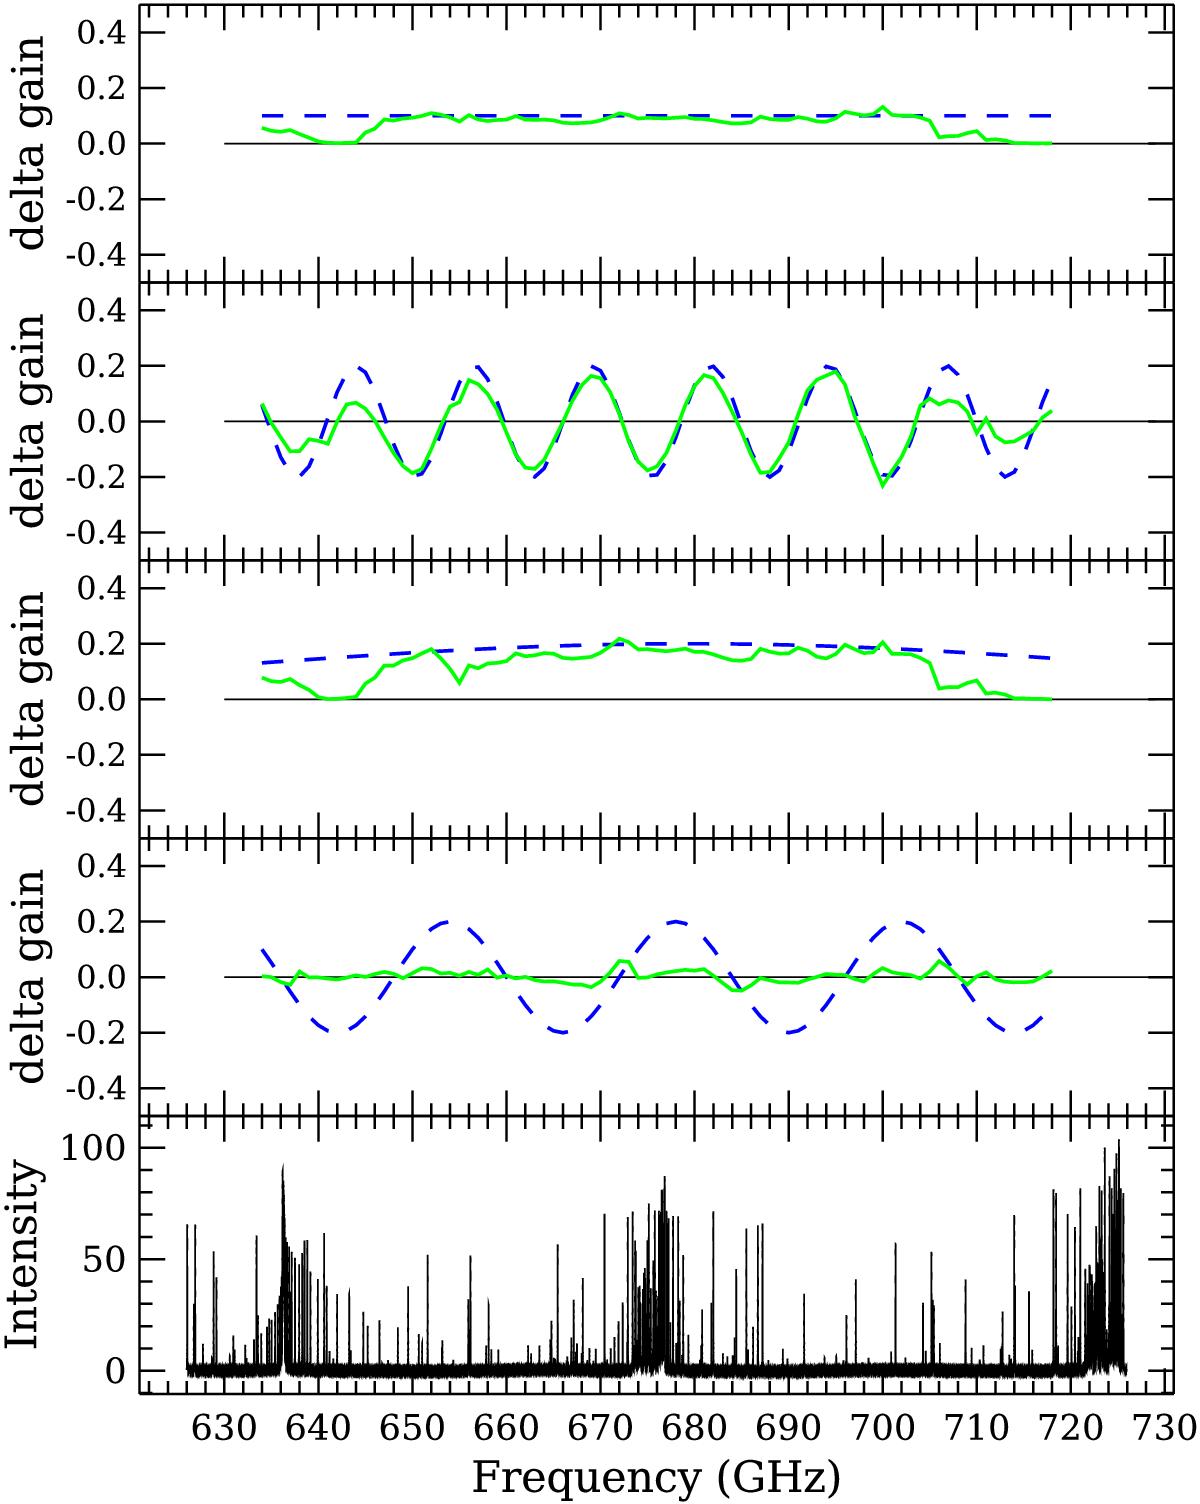
Three successful reconstructions of analytic functions for the delta gain (upper 3 panels) followed by a failed reconstruction of a periodic gain using the alias period of 24 GHz. The reconstructed delta gain is shown in green, while the input delta gain is indicated in dashed blue. The lower panel shows the deconvolved simulated methanol spectrum in arbitrary units.
Current usage metrics show cumulative count of Article Views (full-text article views including HTML views, PDF and ePub downloads, according to the available data) and Abstracts Views on Vision4Press platform.
Data correspond to usage on the plateform after 2015. The current usage metrics is available 48-96 hours after online publication and is updated daily on week days.
Initial download of the metrics may take a while.