Fig. 9
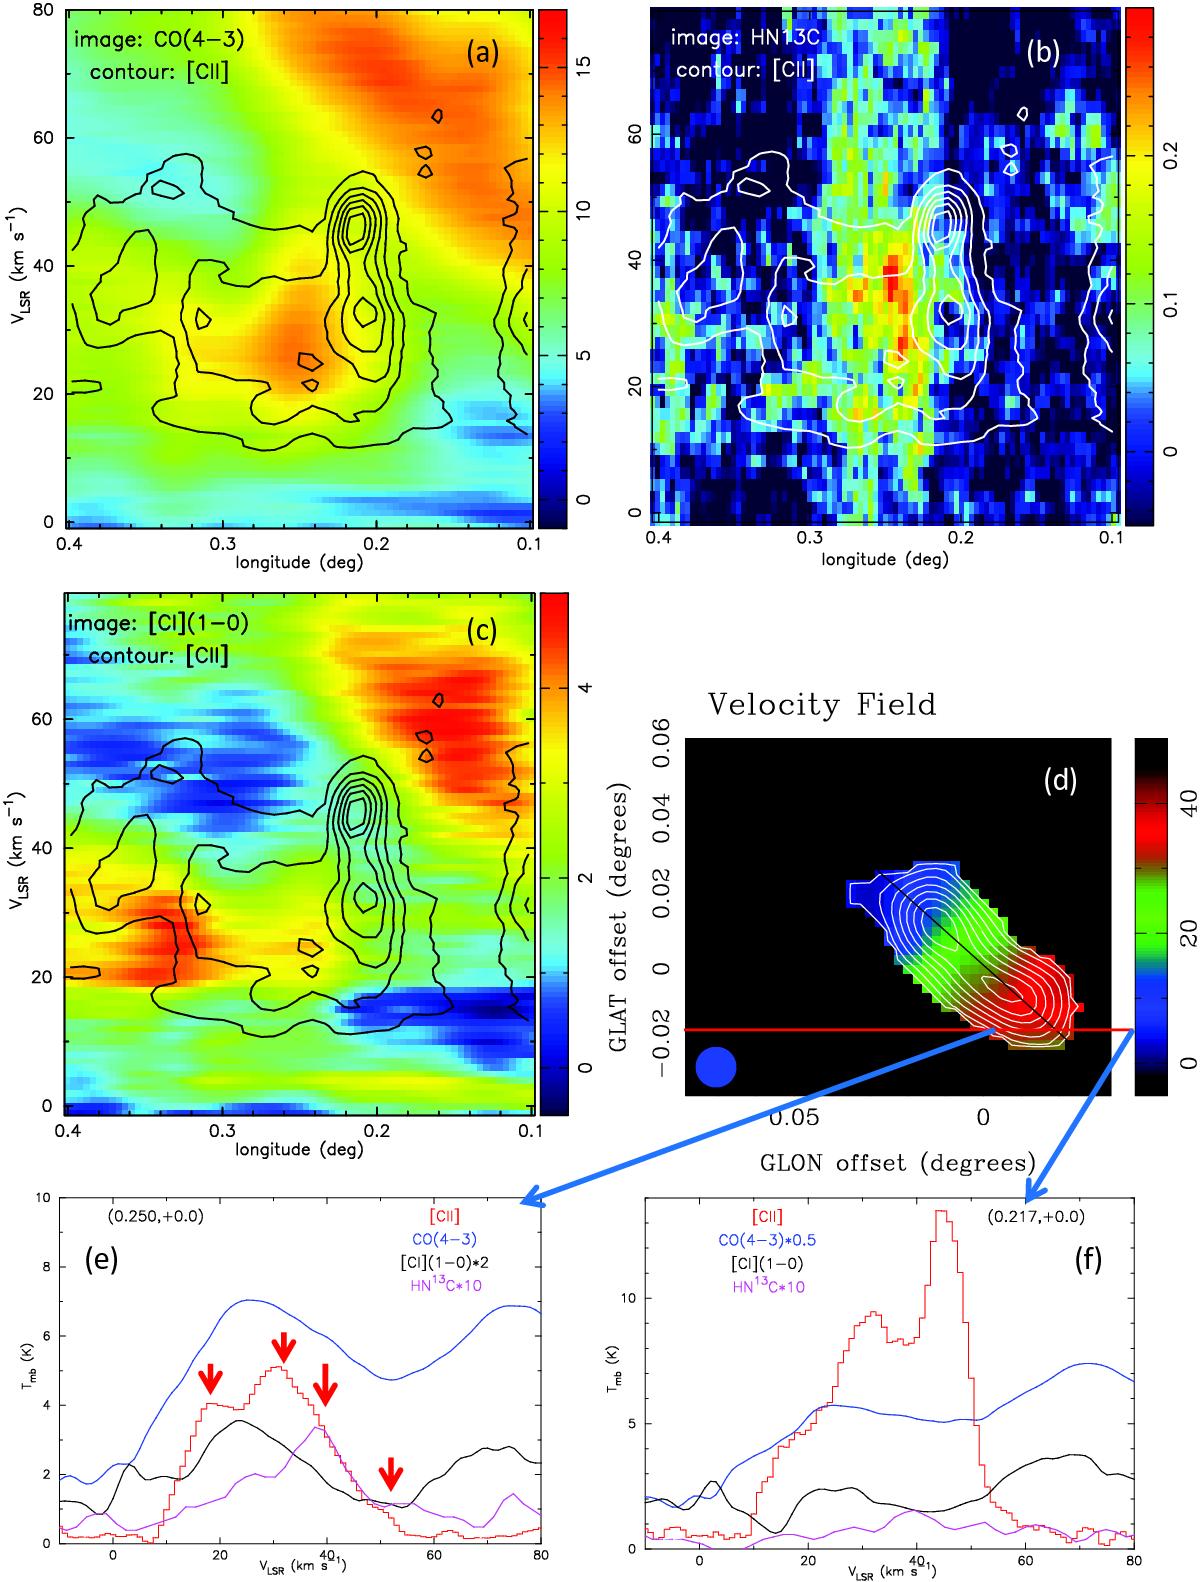
Detailed view of the [C ii] longitude-velocity contour plot of Tmb(K) associated with the Brick plotted over a map of a) CO(4–3) emission (Martin et al. 2004); b) HN13C Mopra data (this paper); and c) [C i] emission (Martin et al. 2004). The color bars give the values of Tmb(K) in the images; [C ii] contour levels are 2, 4, 6, 8, and 10 K, and the peak is 13.5 K; d) the velocity field and HNCO intensity of the Brick from Fig. 6 in Rathborne et al. (2014) where the color bar on the right is the velocity field in km s-1 and the intensity is shown by the contours. This plot is in offsets from the nominal center of the Brick, (l, b) = (0.̊253, 0.̊016). The horizontal red line designates b = 0° and the blue arrows indicate the locations of the spectra shown in panels e) and f) which compare the GOT C+ [C ii] with the AST/RO [C i] and CO(4–3) spectra (Martin et al. 2004), and the Mopra HN13C spectra (this paper) at l = 0.̊250 and 0.̊21667, respectively. The red arrows in e) indicate the four velocity components identified by Henshaw et al. (2016b) in the vicinity of G0.253+0.016 at VLSR ~ 7, 21, 38, and 70 km s-1 from dense gas tracers. The HN13C peak at ~38.4 km s-1 is the feature arising from the Brick at this position. The intensities are given as Tmb(K).
Current usage metrics show cumulative count of Article Views (full-text article views including HTML views, PDF and ePub downloads, according to the available data) and Abstracts Views on Vision4Press platform.
Data correspond to usage on the plateform after 2015. The current usage metrics is available 48-96 hours after online publication and is updated daily on week days.
Initial download of the metrics may take a while.