Fig. 8
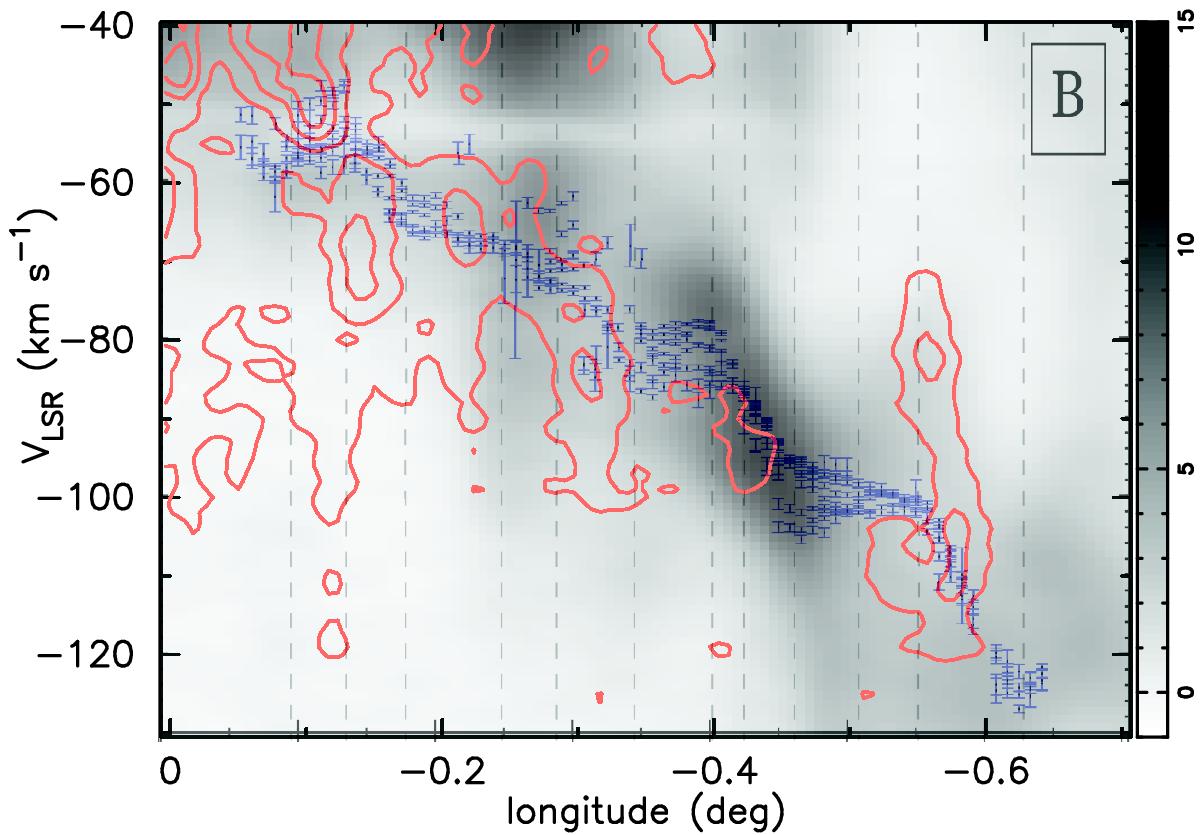
Expanded view of the l-V maps in Fig. 4 consisting of [C ii] contours (red) and the CO(4–3) grey-scale image covering l = −0.̊7 to 0.̊0 and VLSR = −130 km s-1 to −40 km s-1. The [C ii] coutours are Tmb = 1, 2, 3, 4, 5, and 6 K, and the CO(4–3) Tmb values are shown in the color bar on the right. We have superimposed the centroid velocities of the dense cores presented in Fig. 2b from the paper by Henshaw et al. (2016a). (The vertical dashed lines are in the original figure from Henshaw et al. 2016a and identify the correspondence between the gas condensations and the extremes in velocity field amplitude.) It can be seen that the l-V trends of [C ii] and CO(4–3) correlate well with those of the dense cores traced by N2H+.
Current usage metrics show cumulative count of Article Views (full-text article views including HTML views, PDF and ePub downloads, according to the available data) and Abstracts Views on Vision4Press platform.
Data correspond to usage on the plateform after 2015. The current usage metrics is available 48-96 hours after online publication and is updated daily on week days.
Initial download of the metrics may take a while.