Fig. 7
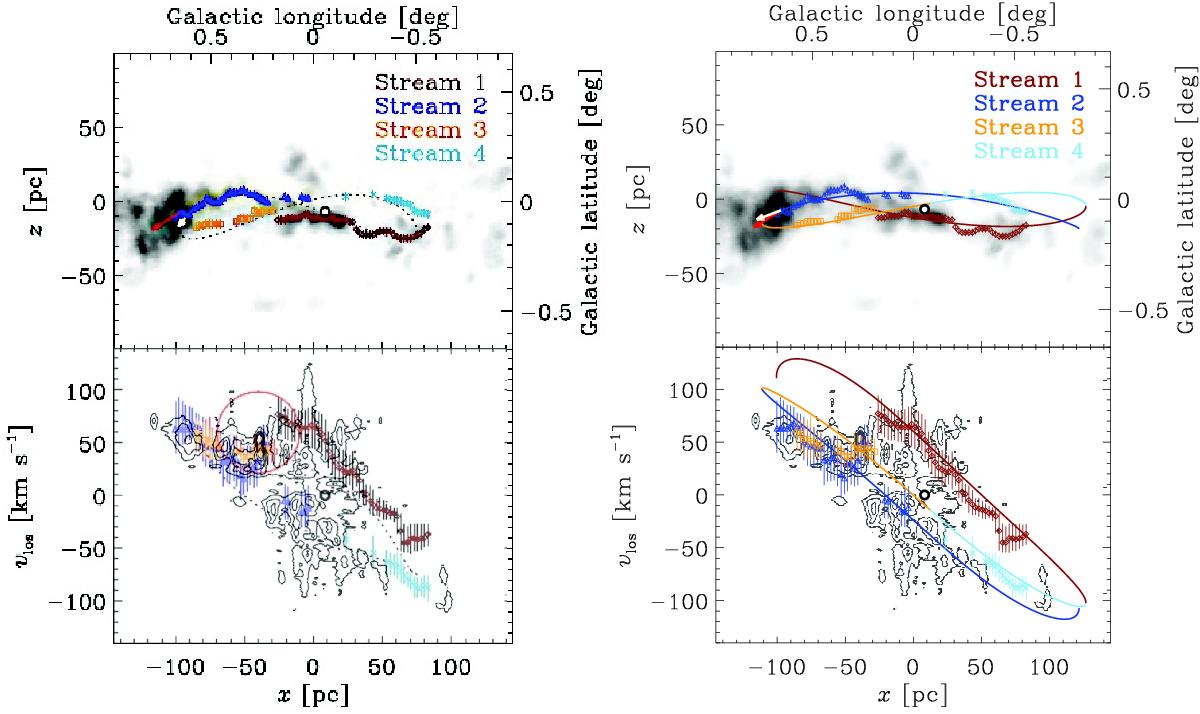
GOT C+ [C ii] (l-V) map compared with the Molinari et al. (2011) orbital model and with the four open stream orbital model of Kruijssen et al. (2015). Left panels: (l-b) and (l-V) maps in which the dotted line indicates the Molinari et al. (2011) orbital model (reproduced from Fig. 2 in Kruijssen et al. 2015). The grey-scale in the top panel is the integrated intensity of NH3(1, 1) emission that traces the dense gas. The symbols with error bars represent the phase-space information extracted by Kruijssen et al. (2015) from NH3(1, 1). The small open black circle denotes Sgr A∗. (The circle in the left panel is in the original figure and indicates a feature in position-velocity space discussed by Kruijssen et al. 2015.) Right panels: (l-b) and (l-V) maps in which the solid open arcs indicate the four open gas streams and the legend labels them by color (reproduced from Fig. 4 in Kruijssen et al. 2015). The GOT C+ OTF scan at b = 0° passes through streams 2 and 4, and passes closest to stream 3 near l ~ 0.̊2 and to stream 4 near l ~ 0.̊05. In the bottom panel the GOT C+ [C ii] longitudinal-velocity contour plots are overlayed on the l-V plots of the four stream open orbit model from Kruijssen et al. (2015).
Current usage metrics show cumulative count of Article Views (full-text article views including HTML views, PDF and ePub downloads, according to the available data) and Abstracts Views on Vision4Press platform.
Data correspond to usage on the plateform after 2015. The current usage metrics is available 48-96 hours after online publication and is updated daily on week days.
Initial download of the metrics may take a while.