Fig. 4
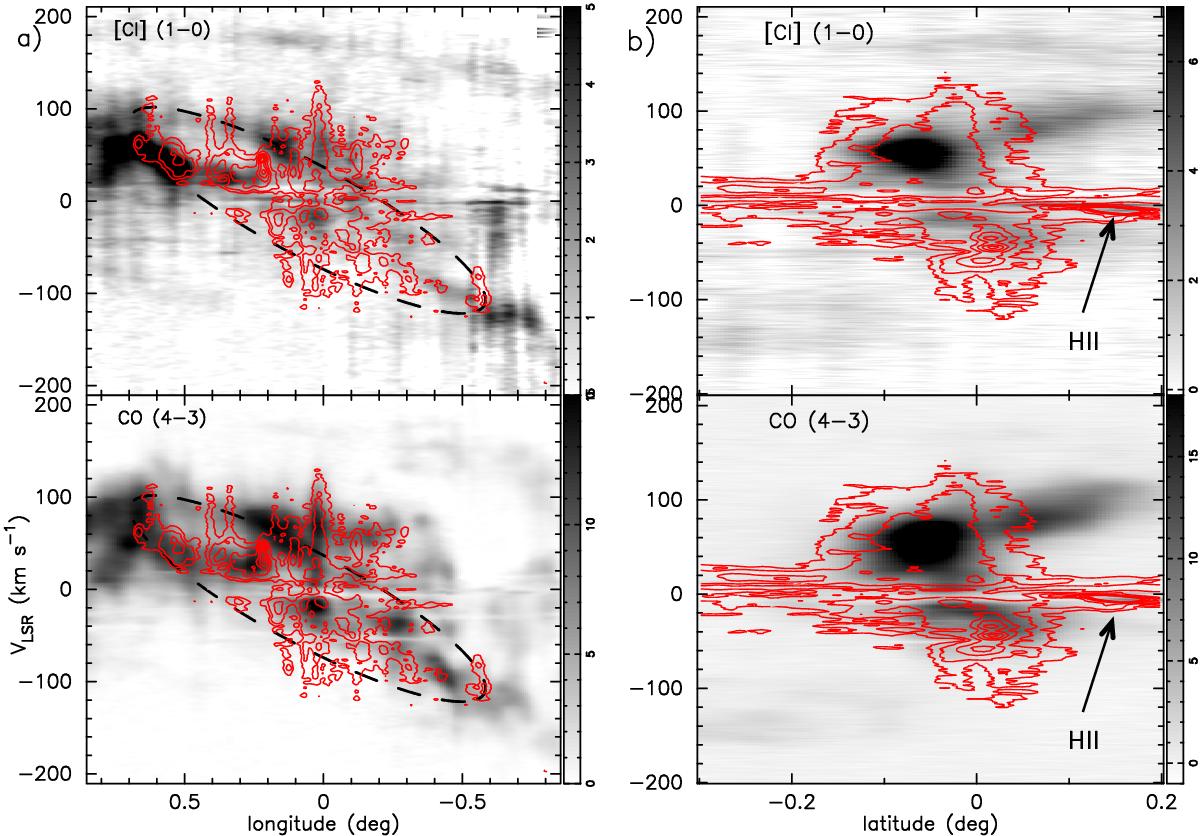
Comparison of the [C ii] position-velocity strip scans with the AST/RO observations of [C i] and CO(4–3) (Martin et al. 2004). a) The [C ii] longitude-velocity strip scan and b) the latitude-velocity strip scan. The [C i] and CO maps are shown in gray scale, where the grey scale bars on the right hand side indicate the main beam temperatures, Tmb(K); the corresponding [C ii] emission maps are overlaid as contours. The [C ii] contour levels (red) are Tmb(K) = 1, 2, 4, 6, 8, and 10. In the l-V maps the dashed line roughly outlines the [C ii] emission at b = 0.̊0 for the elliptical ring model of Molinari et al. (2011; see also Fig. 2). This ellipse is used only to delineate the l-V space where the open orbit gas streams can be found, and is not intended as a model of the gas dynamics. The arrows in panel b) indicate a local H ii source (see Sect. 4.8).
Current usage metrics show cumulative count of Article Views (full-text article views including HTML views, PDF and ePub downloads, according to the available data) and Abstracts Views on Vision4Press platform.
Data correspond to usage on the plateform after 2015. The current usage metrics is available 48-96 hours after online publication and is updated daily on week days.
Initial download of the metrics may take a while.