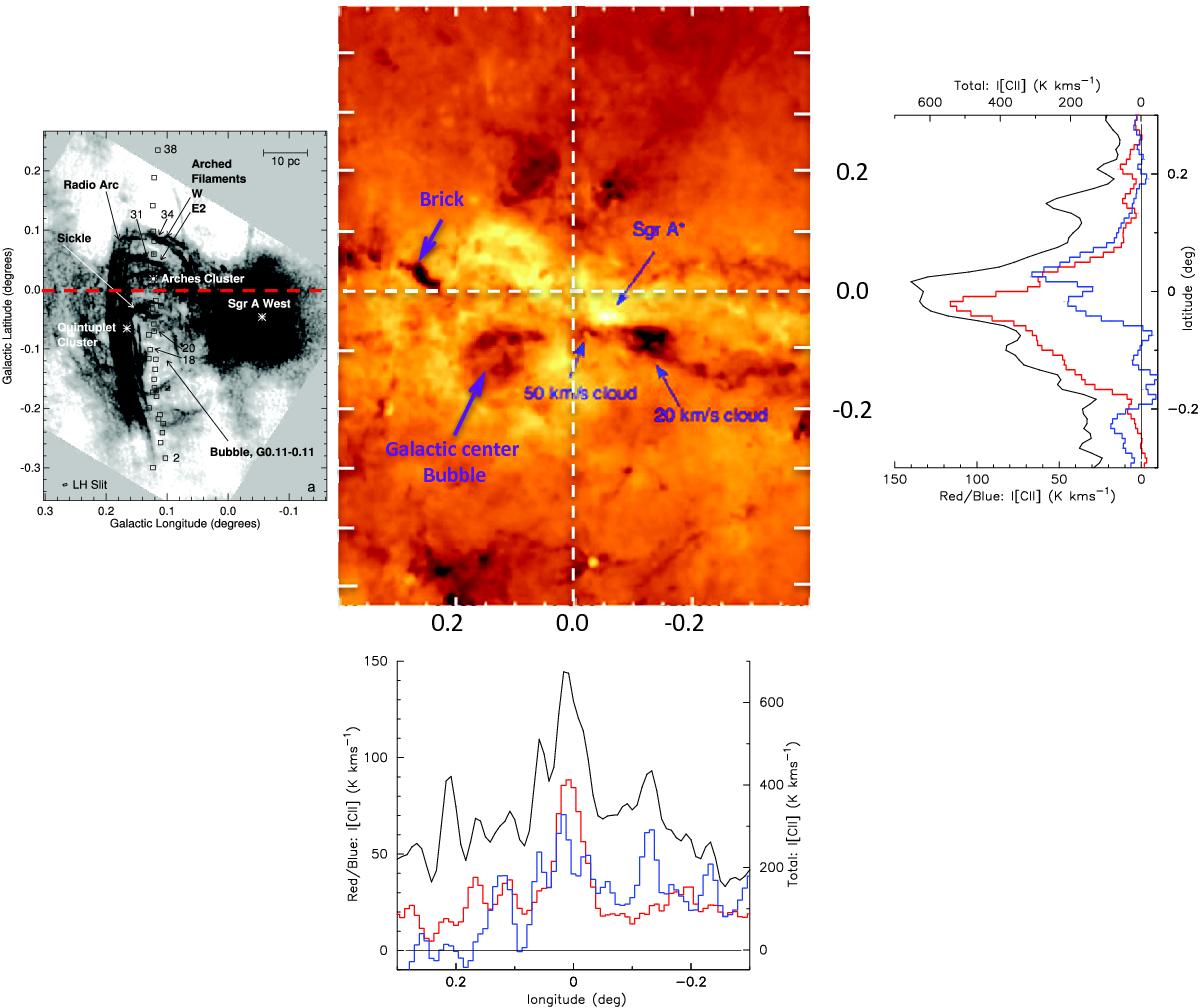
Fig. 3

The center image is the dust temperature distribution of the inner CMZ derived from Herschel HI-GAL 70–350 μm images (Molinari et al. 2011). It has a doughnut shaped distribution as seen in projection marking a warm dust bubble (Molinari et al. 2011, 2014). On the left is the radio continuum map generated by Simpson et al. (2007) based on the data of Yusef-Zadeh & Morris (1987) of the central portion of the bubble (the hole in the doughnut) containing the Radio Arc and arched filaments. The [C ii] integrated intensity, I([C ii]) (K km s-1), strip scans as a function of longitude and latitude are plotted to the bottom and the right, respectively, and are aligned with the temperature map of the inner CMZ. These plots show the velocity-integrated [C ii] intensity profiles as functions of longitude or latitude: the black lines represent the total intensity in the velocity range VLSR = −200 to +140 km s-1, the red and blue lines represent I([C ii]) integrated emission in the high-velocity red and blue wings from VLSR = + 80 to +130 km s-1 and −80 to −130 km s-1, respectively.
Current usage metrics show cumulative count of Article Views (full-text article views including HTML views, PDF and ePub downloads, according to the available data) and Abstracts Views on Vision4Press platform.
Data correspond to usage on the plateform after 2015. The current usage metrics is available 48-96 hours after online publication and is updated daily on week days.
Initial download of the metrics may take a while.


