Fig. 2
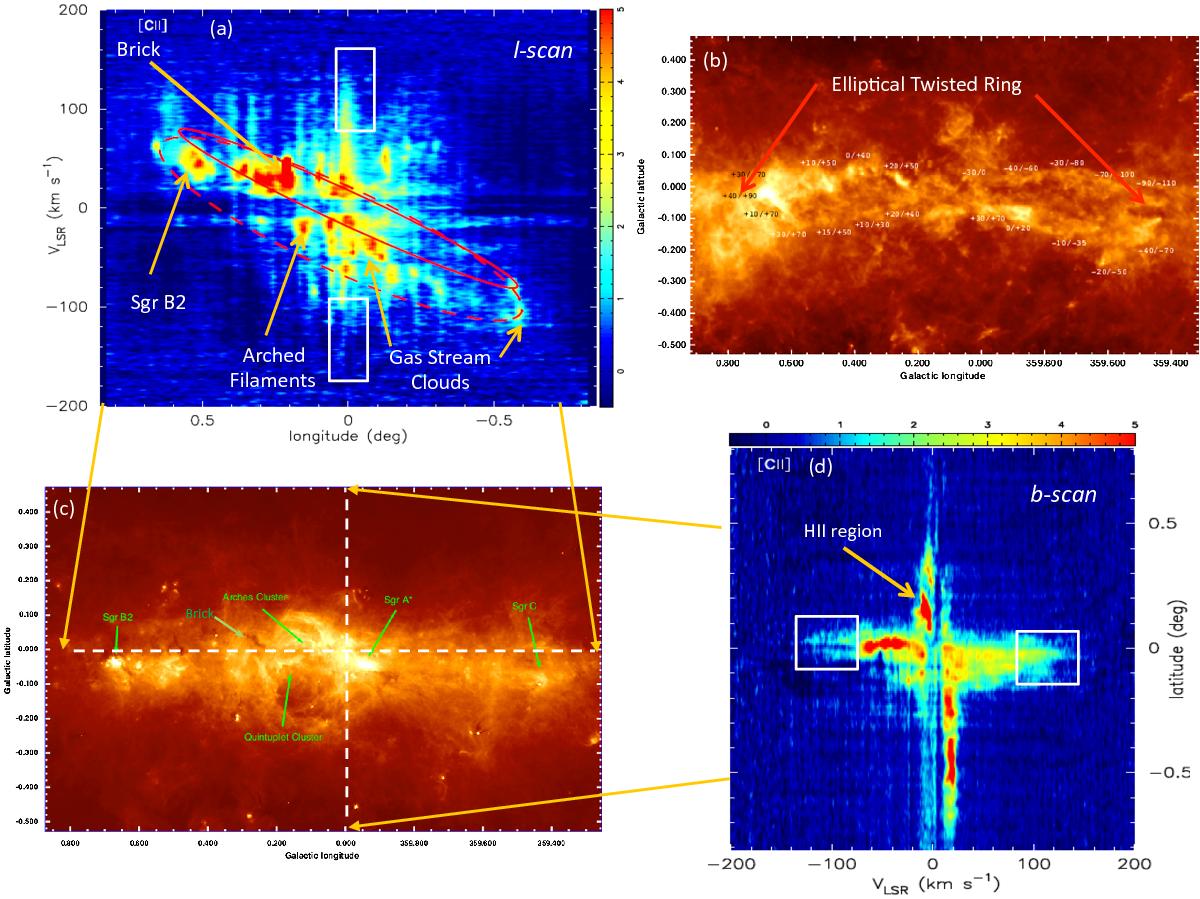
HIFI position-velocity [C ii] maps of the CMZ tracing several notable features, including the Brick, open orbit streams of molecular gas, Sgr B2, and the arched filament. a) The [C ii] longitude-velocity map, l-V, covering 1.̊6 centered at (0°, 0°). The color bar indicates the [C ii] main beam temperature, Tmb(K). The red-solid ellipse is the solution at z = 0.̊0 for the elliptical ring model from Molinari et al. (2011) in longitude-velocity space and the red-dashed ellipse is our fit to the [C ii] observations assuming an ellipse. The vertical striations are artifacts of the baseline uncertainties (see Sect. 2). b) Atomic hydrogen column density map from Molinari et al. (2011) highlighting their elliptical twisted ring model. The line-of-sight velocity along the ring was derived by Molinari et al. (2011) from CS observations and is marked along the ring (see the original figure). c) A Herschel PACS 70 μm image of the CMZ from Fig. 1 of Molinari et al. (2011). The [C ii] OTF strip scans in l and b are indicated by white dashed lines. The labels in green are from Molinari et al. (2011), except for the Brick (G0.253+0.016). d) The [C ii] latitude-velocity map, b-V, covering 1.̊6 centered at (0°, 0°). The color bar indicates Tmb([C ii]) in degrees K. In both l-V (panel a)) and b-V (panel d)) we highlight the position-velocity extent of the high velocity gas near the center (white boxes). The arrow indicates a very bright [C ii] peak that is likely a foreground H ii source (see Sect. 4.8).
Current usage metrics show cumulative count of Article Views (full-text article views including HTML views, PDF and ePub downloads, according to the available data) and Abstracts Views on Vision4Press platform.
Data correspond to usage on the plateform after 2015. The current usage metrics is available 48-96 hours after online publication and is updated daily on week days.
Initial download of the metrics may take a while.