Fig. 11
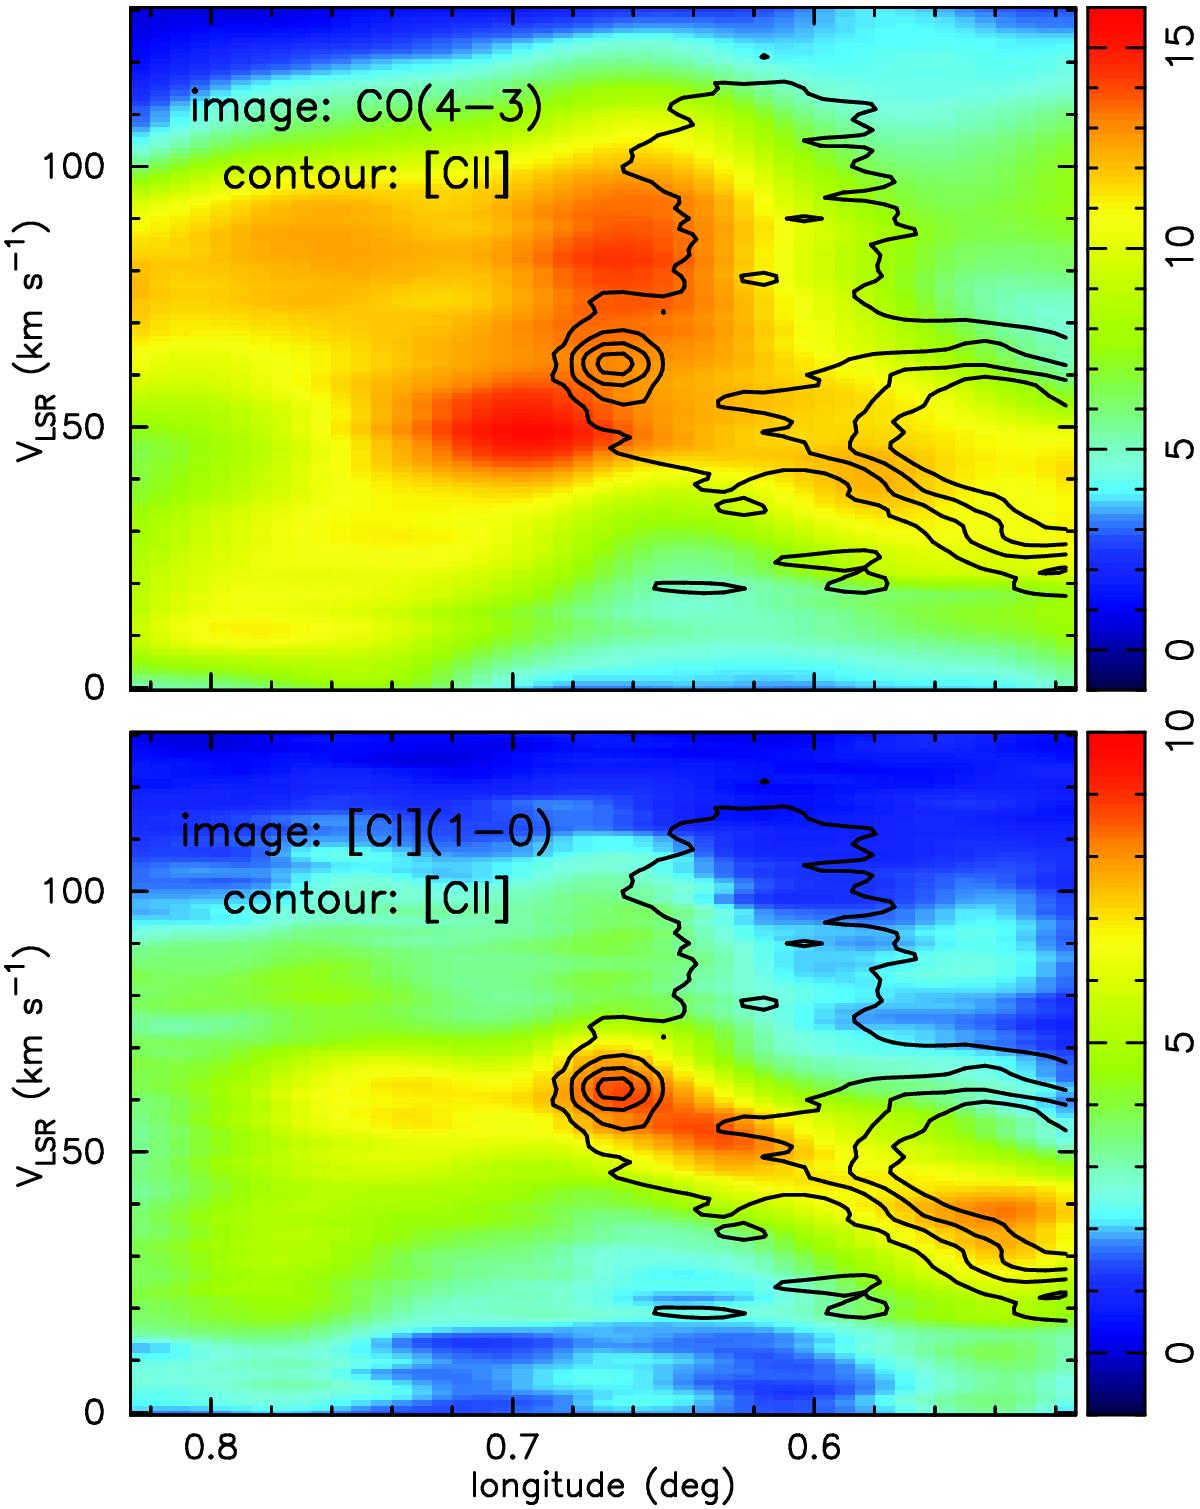
Top: [C ii] l-V contour map including longitudes closest to Sgr B2 overlayed on an image of the AST/RO CO(4–3) emission. Bottom: same for [C ii] overlayed on the [C i] image. The [C ii] contours are in Tmb(K) and have the values 0.75, 1.5, 2.25, and 3.0 K. The values of Tmb(K) for the CO and [C i] images are given by the color bars on the right of each panel.
Current usage metrics show cumulative count of Article Views (full-text article views including HTML views, PDF and ePub downloads, according to the available data) and Abstracts Views on Vision4Press platform.
Data correspond to usage on the plateform after 2015. The current usage metrics is available 48-96 hours after online publication and is updated daily on week days.
Initial download of the metrics may take a while.