Fig. 1
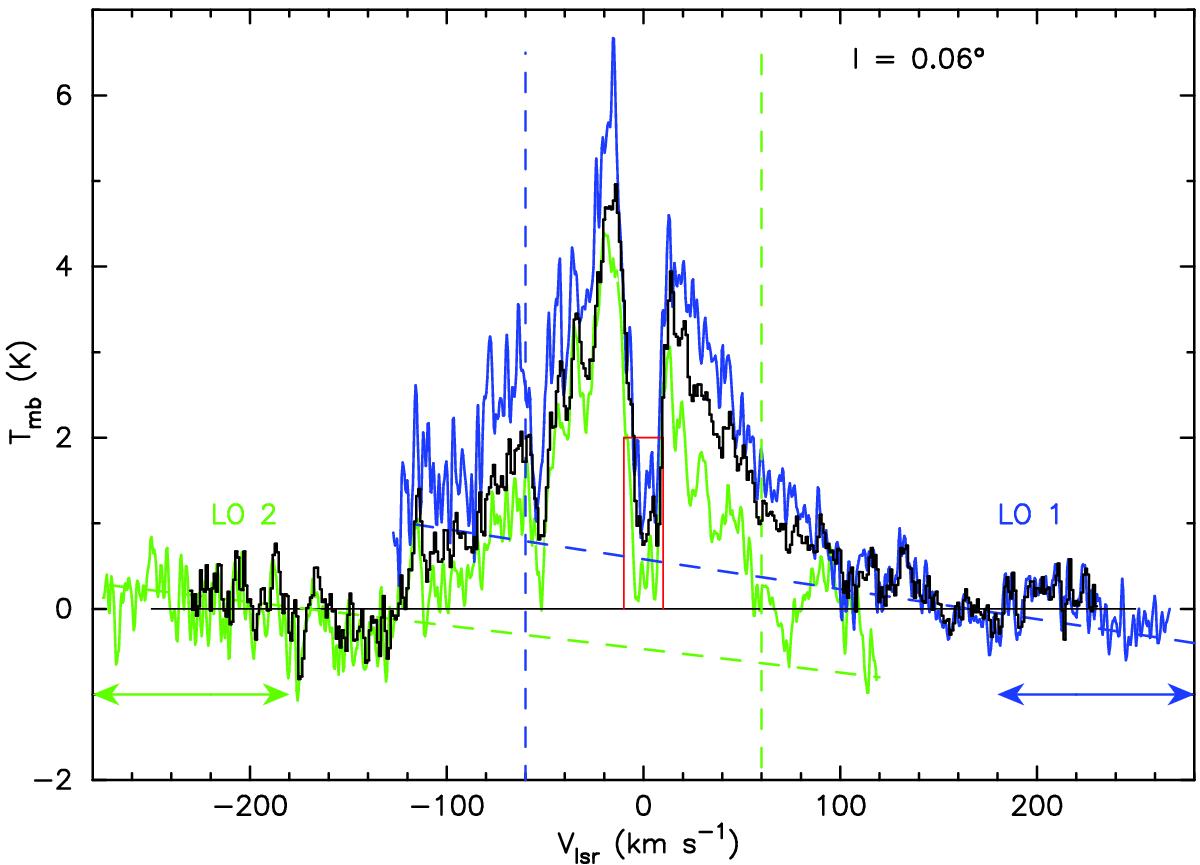
Example of combining the two LO spectra in OTF scan maps. The spectra at l = 0.̊06 in the individual longitude scan maps consist of two local oscillator settings, LO 1 (blue) and LO 2 (green). The final averaged spectrum is shown in black. The double arrows mark the velocity range of a constant baseline offset used in the corresponding maps. The red box denotes the velocity range (±10 km s-1) for matching the two spectra and the baseline offsets here were estimated using their averaged intensity. The quasi-horizontal dashed lines represent a linear fit to the baselines used for the spectra for final averaging. The vertical dashed lines mark velocity limits above (green) and below (blue) where the data are unusable (near the edges of the band pass). The spectra for velocities within ±60 km s-1 were averaged with baseline corrections for V < −60 and V > +60 km s-1 for LO 2 and LO 1, respectively. Note that the absorption feature around 0 km s-1 is due to local gas.
Current usage metrics show cumulative count of Article Views (full-text article views including HTML views, PDF and ePub downloads, according to the available data) and Abstracts Views on Vision4Press platform.
Data correspond to usage on the plateform after 2015. The current usage metrics is available 48-96 hours after online publication and is updated daily on week days.
Initial download of the metrics may take a while.