Fig. 9
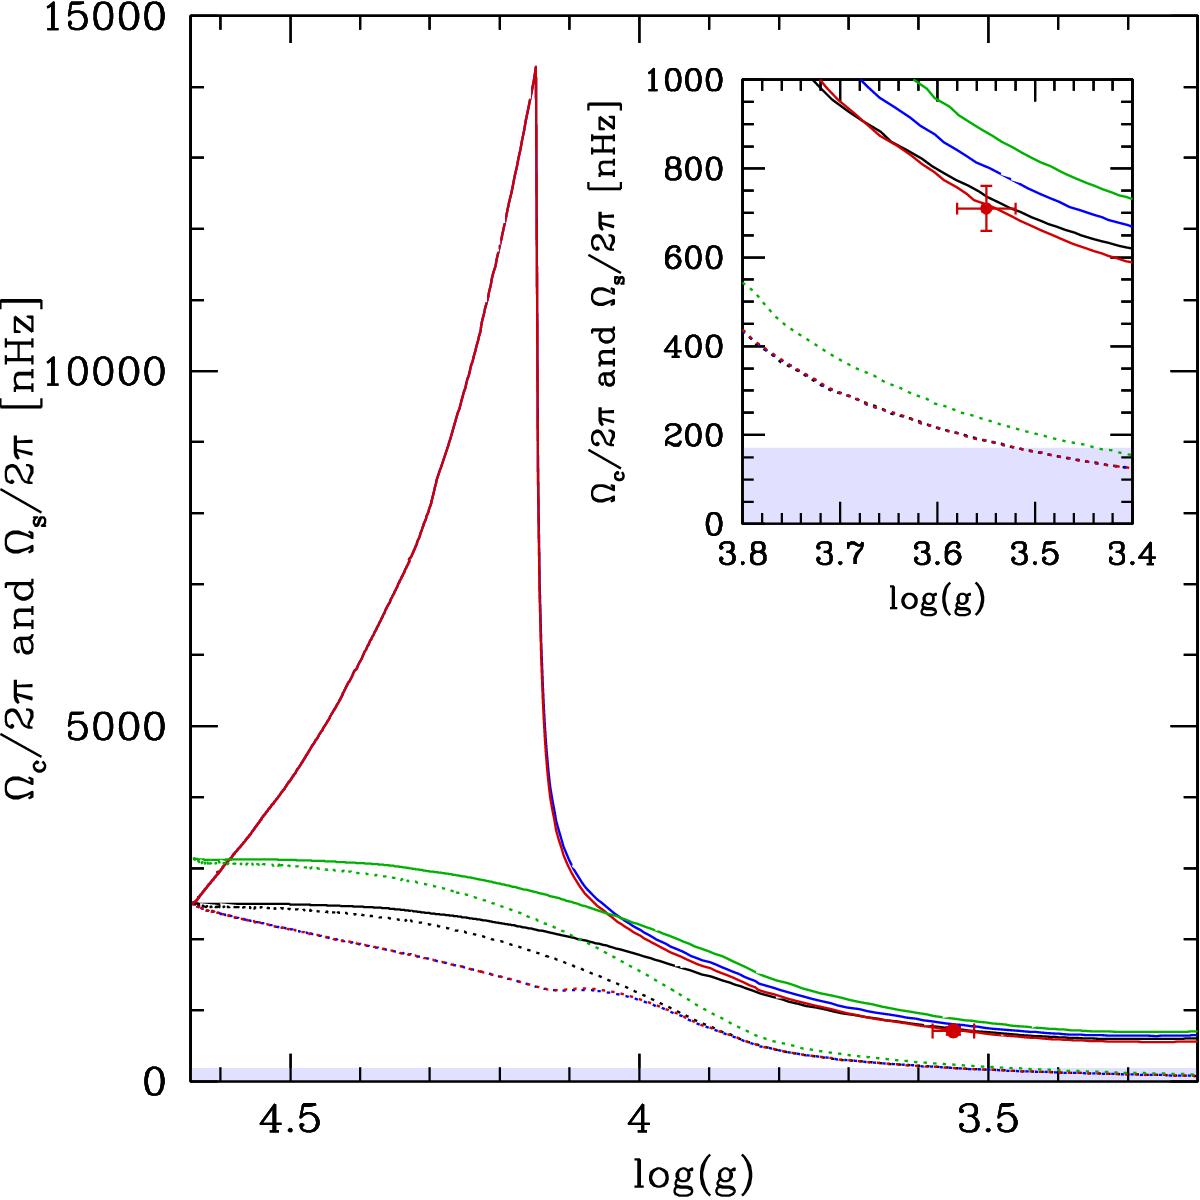
Core (continuous lines) and surface (dotted lines) rotation rates for models computed with and without an additional viscosity during the main sequence. These models do not include a braking of the surface by magnetized winds. The black and green lines indicate models with an additional viscosity of 1 × 104 cm2 s-1 during the whole evolution and an initial velocity on the ZAMS of 8 and 10 km s-1, respectively. The blue and red lines correspond to models without an additional viscosity during the main sequence, with an initial velocity on the ZAMS of 8 km s-1, and an additional viscosity during the post-main sequence of 1 × 10⁴ and 1.1 × 104 cm2 s-1, respectively.
Current usage metrics show cumulative count of Article Views (full-text article views including HTML views, PDF and ePub downloads, according to the available data) and Abstracts Views on Vision4Press platform.
Data correspond to usage on the plateform after 2015. The current usage metrics is available 48-96 hours after online publication and is updated daily on week days.
Initial download of the metrics may take a while.