Free Access
Fig. 4
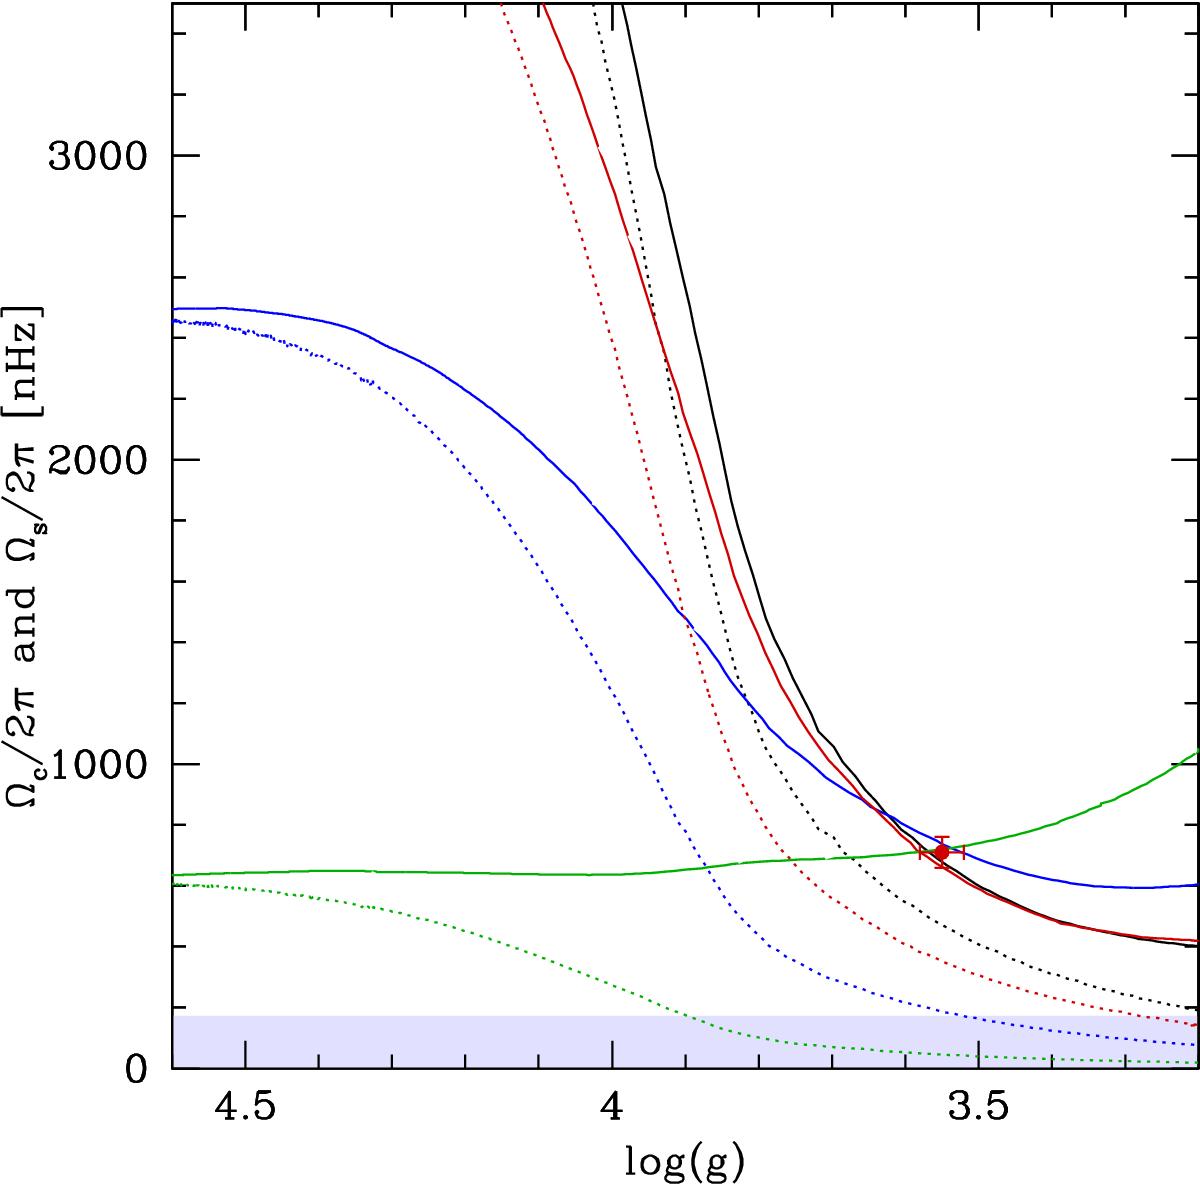
Same as Fig. 2, but for models of KIC 7341231 computed with different values of the additional viscosity. Black, red, blue, and green lines correspond to an additional viscosity of 3 × 10⁴, 2 × 10⁴, 1 × 10⁴, and 3 × 103 cm2 s-1, and initial velocities on the ZAMS of 20, 15, 8, and 2 km s-1, respectively.
Current usage metrics show cumulative count of Article Views (full-text article views including HTML views, PDF and ePub downloads, according to the available data) and Abstracts Views on Vision4Press platform.
Data correspond to usage on the plateform after 2015. The current usage metrics is available 48-96 hours after online publication and is updated daily on week days.
Initial download of the metrics may take a while.