Fig. 12
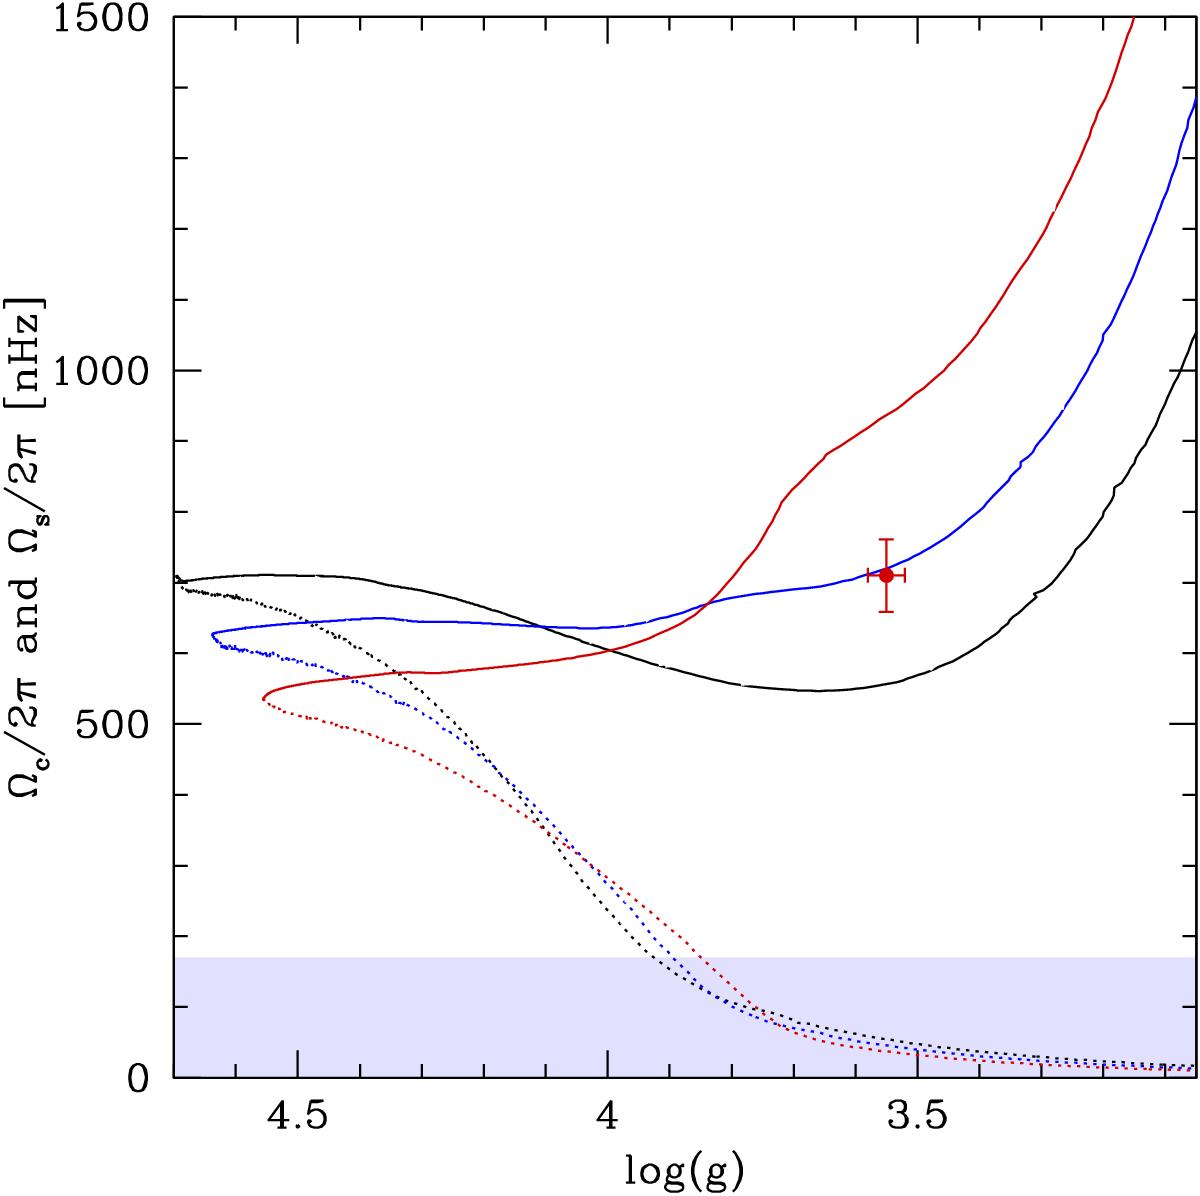
Core (continuous lines) and surface (dotted lines) rotation rates as a function of gravity for rotating models with different masses. Black, blue, and red lines indicate a mass of 0.75, 0.84, and 0.95 M⊙, respectively. All models are computed with an initial velocity on the ZAMS of 2 km s-1 and an additional viscosity of 3 × 103 cm2 s-1 (νadd is included during the whole evolution of the model). The red dot corresponds to the core rotation rate of KIC 7341231 (Deheuvels et al. 2012).
Current usage metrics show cumulative count of Article Views (full-text article views including HTML views, PDF and ePub downloads, according to the available data) and Abstracts Views on Vision4Press platform.
Data correspond to usage on the plateform after 2015. The current usage metrics is available 48-96 hours after online publication and is updated daily on week days.
Initial download of the metrics may take a while.