Fig. 8
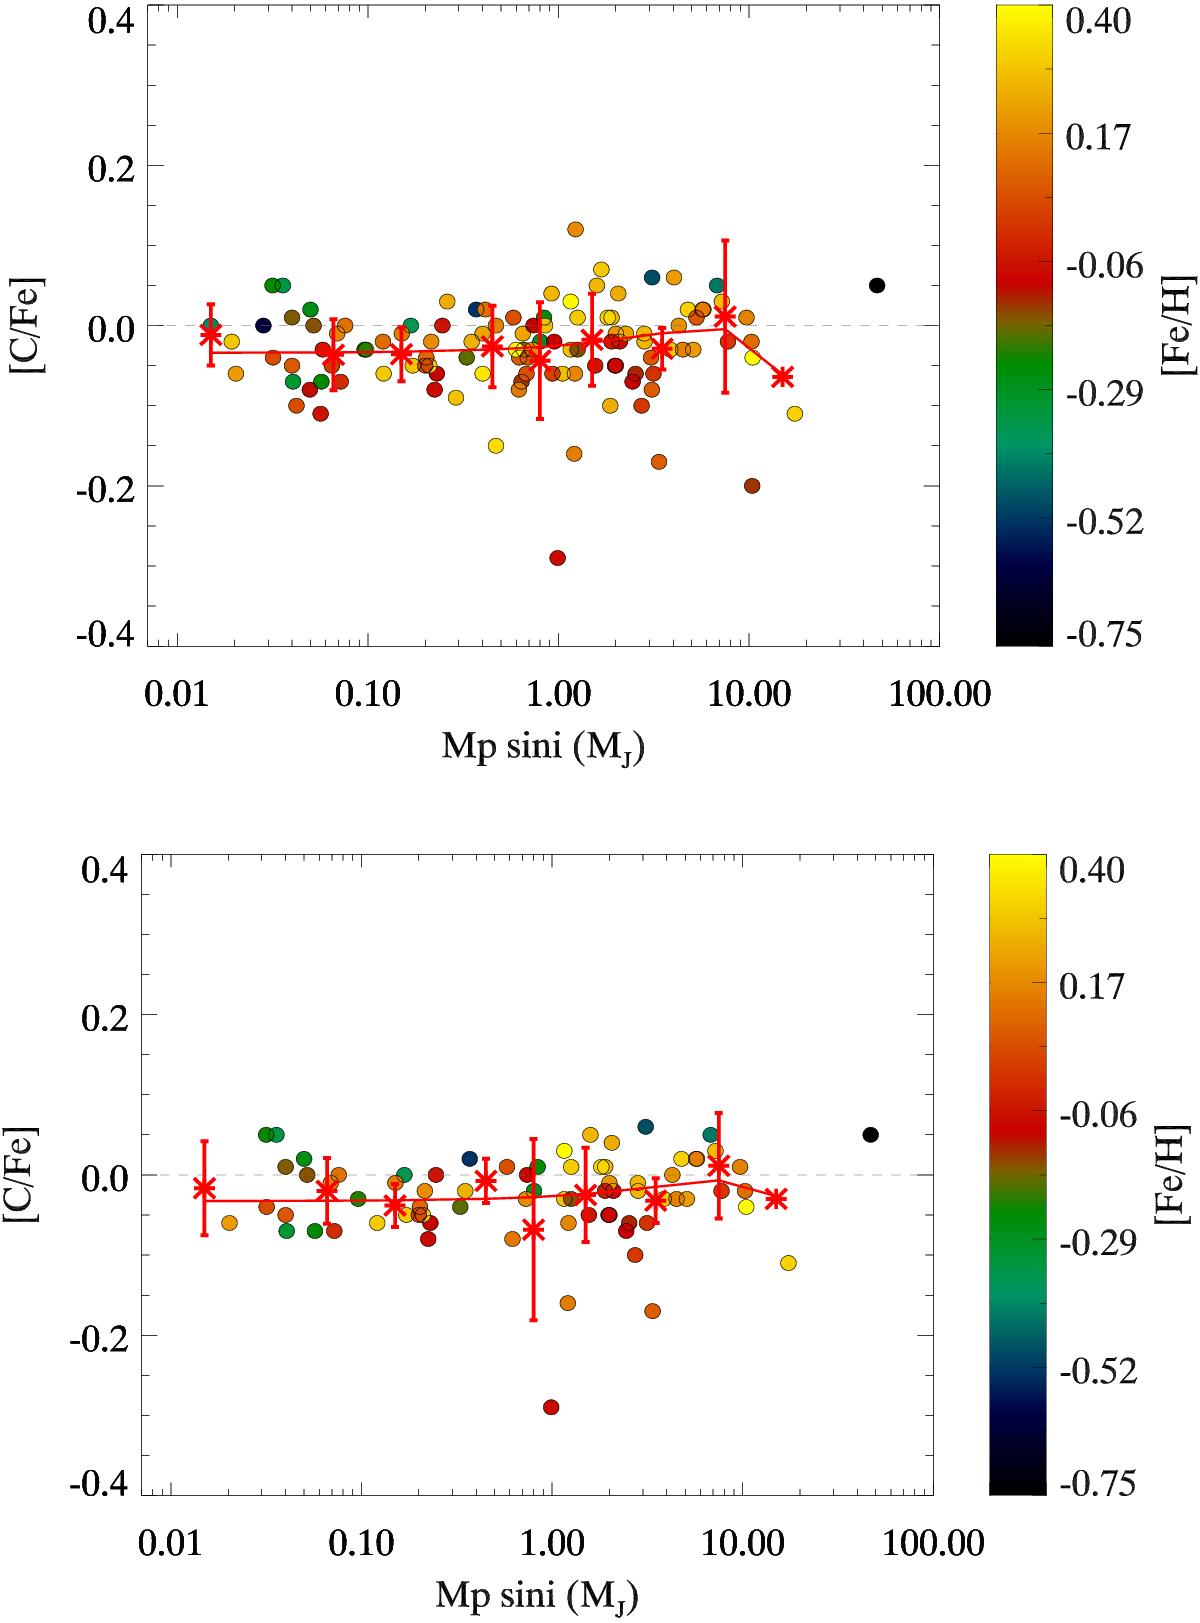
[C/Fe] versus Mpsini plot. Filled circles represent the whole sample, whereas red asterisks represent binned values. Hotter colours represent metallicities above solar while cooler colours represent metallicies below solar. Also in red, the fit for these binned values. In the top panel, for all the studied sample, in the bottom, for solar analogues (Teff = Teff, ⊙ ± 300 K).
Current usage metrics show cumulative count of Article Views (full-text article views including HTML views, PDF and ePub downloads, according to the available data) and Abstracts Views on Vision4Press platform.
Data correspond to usage on the plateform after 2015. The current usage metrics is available 48-96 hours after online publication and is updated daily on week days.
Initial download of the metrics may take a while.