Fig. 9
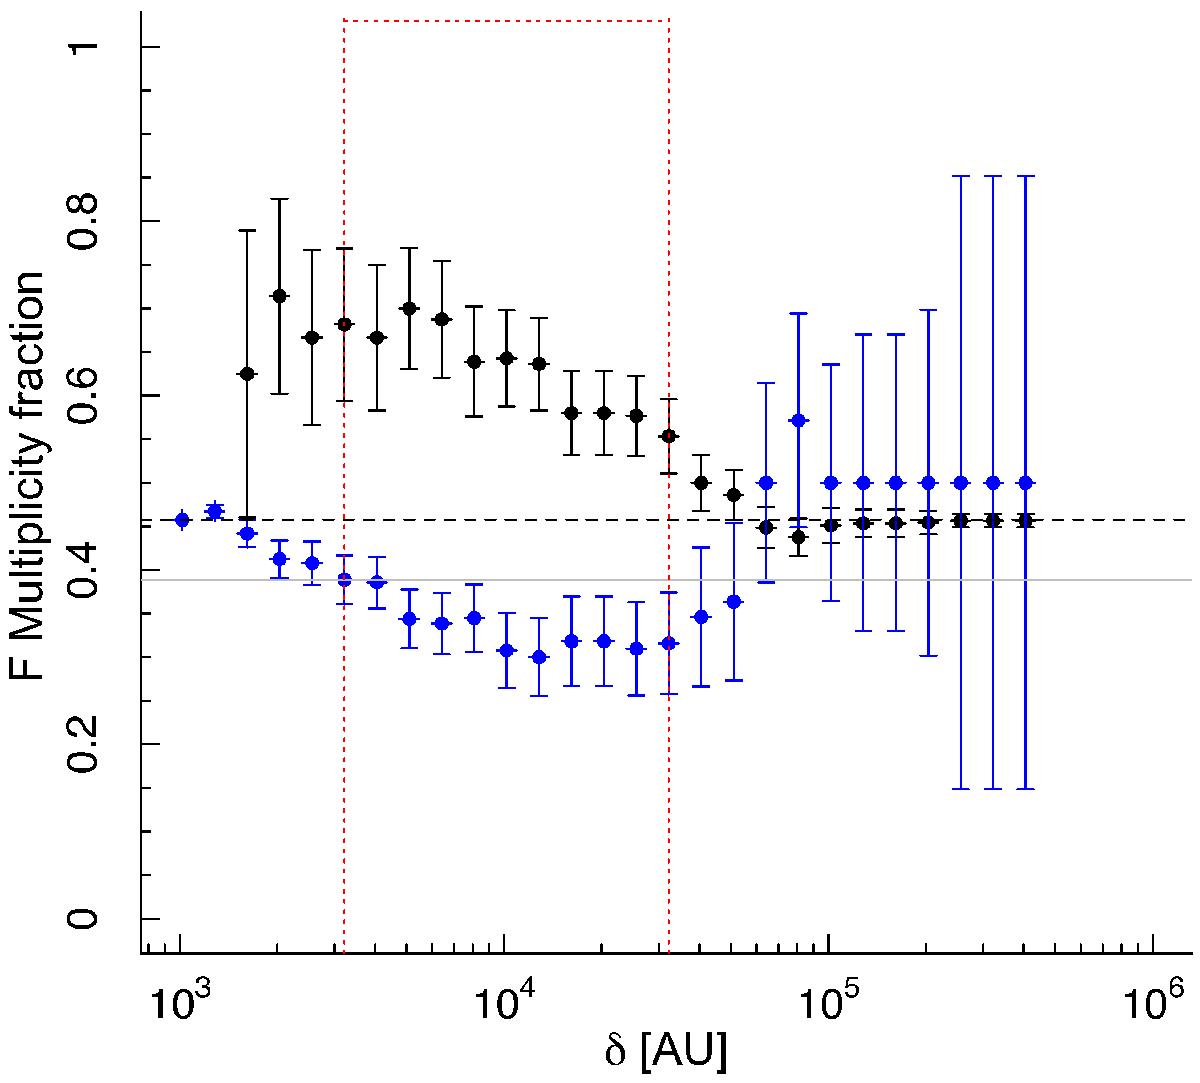
Multiplicity fraction of Class II and III stars observed at HAR and members of UWPs as a function of their separation. For a given value of δ, the black (resp. blue) symbol represents the multiplicity fraction computed over all separations smaller (resp. greater) than δ. Errorbars are standard errors computed from the standard formula: ![]() where ni is the sample size, and N is the total population size of Class II and III stars observed at HAR within UWPs independently of their separation. The dashed black line represents the mean multiplicity fraction for stars within UWPs whereas the gray line marks the corresponding mean multiplicity fraction for stars that are not in UWPs. The red dotted lines define the interval within which the multiplicity fraction within UWPs is significantly (p-value of 0.05 or less based on a chi-squared test) higher than the mean value.
where ni is the sample size, and N is the total population size of Class II and III stars observed at HAR within UWPs independently of their separation. The dashed black line represents the mean multiplicity fraction for stars within UWPs whereas the gray line marks the corresponding mean multiplicity fraction for stars that are not in UWPs. The red dotted lines define the interval within which the multiplicity fraction within UWPs is significantly (p-value of 0.05 or less based on a chi-squared test) higher than the mean value.
Current usage metrics show cumulative count of Article Views (full-text article views including HTML views, PDF and ePub downloads, according to the available data) and Abstracts Views on Vision4Press platform.
Data correspond to usage on the plateform after 2015. The current usage metrics is available 48-96 hours after online publication and is updated daily on week days.
Initial download of the metrics may take a while.