Fig. 7
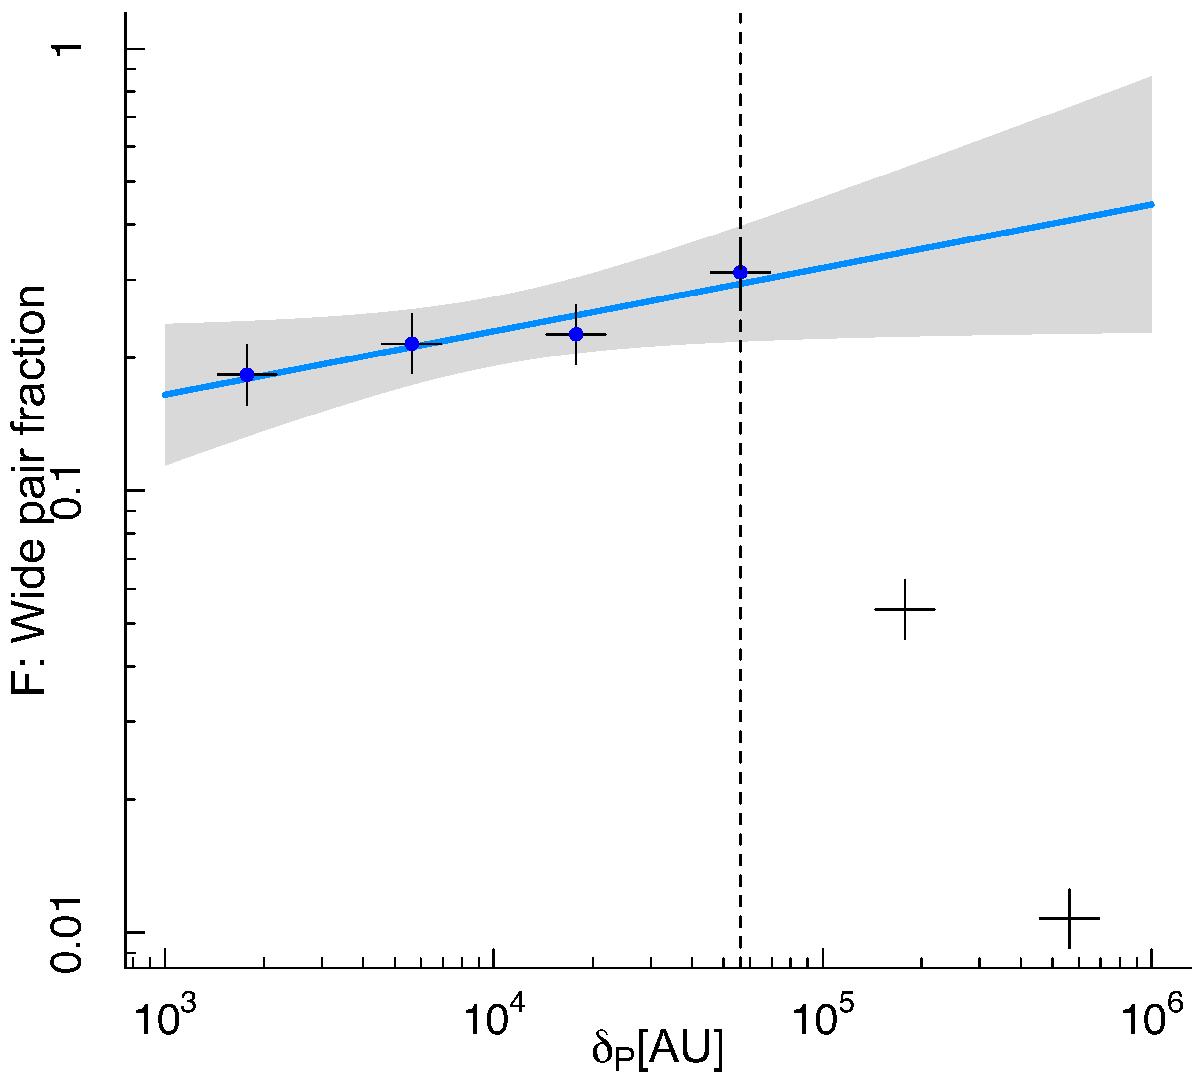
Ultra-wide pair fraction F within the whole Taurus region (sample S1) as a function of separation, plotted using ΔδP = 0.25 dex bins. The solid blue line is a power law fit to the data (![]() , with log α = −1.21 and β = 0.14) between 3 and ~60 kAU (vertical black dashed line). The gray area represents the 95% confidence band. In terms of the power law parameters, the corresponding parameter 95% confidence intervals are log α = [ −1.78,−0.65 ], β = [ 0,0.28 ].
, with log α = −1.21 and β = 0.14) between 3 and ~60 kAU (vertical black dashed line). The gray area represents the 95% confidence band. In terms of the power law parameters, the corresponding parameter 95% confidence intervals are log α = [ −1.78,−0.65 ], β = [ 0,0.28 ].
Current usage metrics show cumulative count of Article Views (full-text article views including HTML views, PDF and ePub downloads, according to the available data) and Abstracts Views on Vision4Press platform.
Data correspond to usage on the plateform after 2015. The current usage metrics is available 48-96 hours after online publication and is updated daily on week days.
Initial download of the metrics may take a while.