Fig. 6
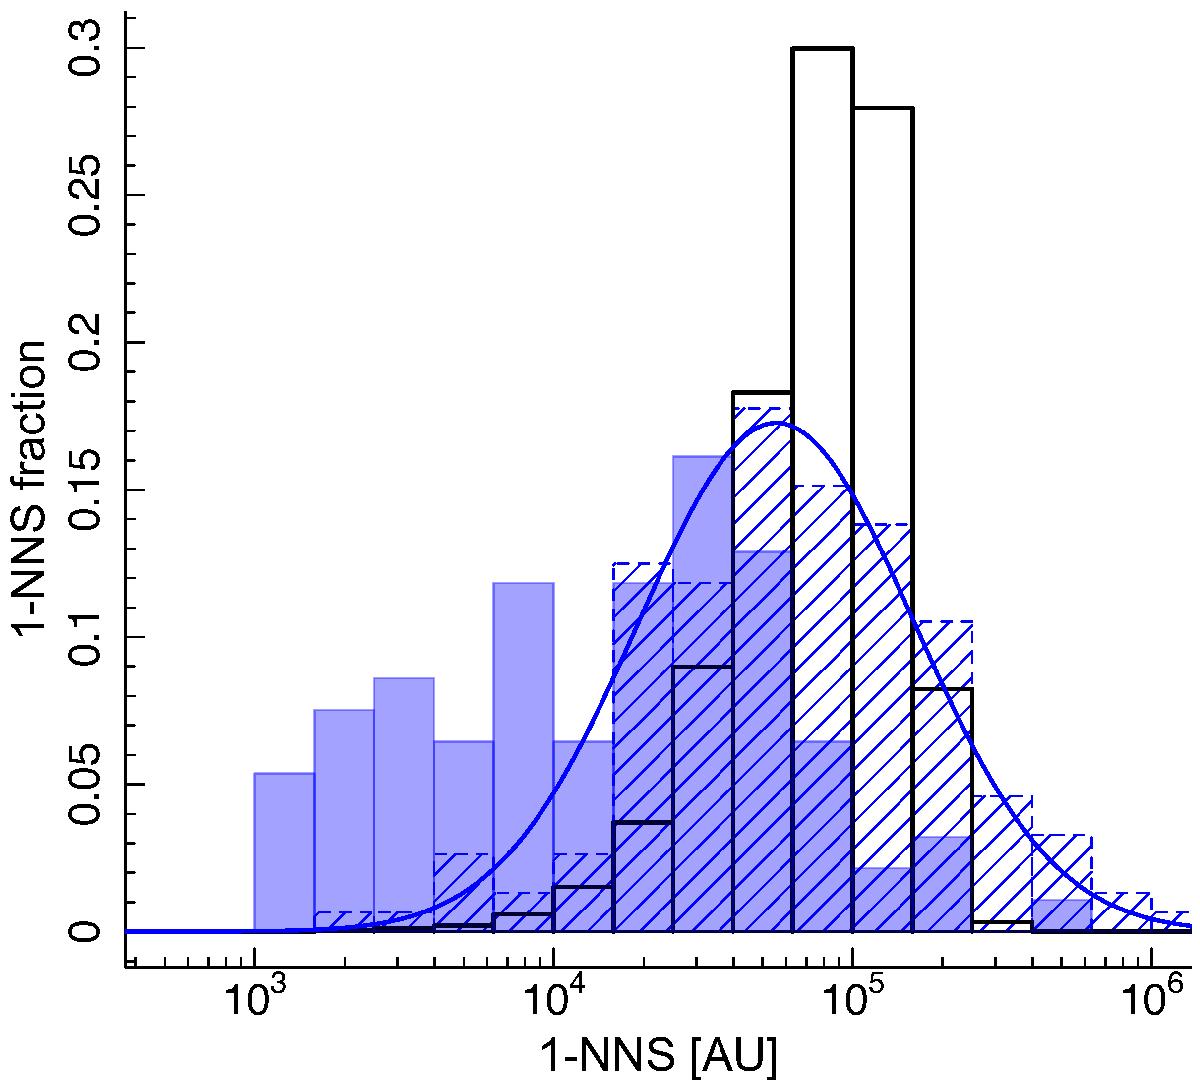
Distribution of ultra-wide pair fraction as a function of separation in the three main Taurus filaments (i.e., for stars enclosed within Win, solid blue histogram) versus pair fraction of random mutual pairs (obtained from 10 000 Monte Carlo samplings, thick black histogram) and 1-NNS fraction of non-mutual pairs (dashed blue histogram). The solid blue line represent a log-normal fit to the distribution of non-mutual pairs in Taurus. The distribution of mutual pairs of Taurus does not result from a random process (p-value of 10-16), and is statistically different from non-mutual pairs distribution in Taurus (p-value of 10-14). Conversely, the 1-NNS distribution of non-mutual pairs in Taurus is reasonably well fitted (p-value of 0.2) by a long-normal function, with a mean value μ = 4.74 ± 0.04 and a standard deviation σ = 0.46 ± 0.03.
Current usage metrics show cumulative count of Article Views (full-text article views including HTML views, PDF and ePub downloads, according to the available data) and Abstracts Views on Vision4Press platform.
Data correspond to usage on the plateform after 2015. The current usage metrics is available 48-96 hours after online publication and is updated daily on week days.
Initial download of the metrics may take a while.