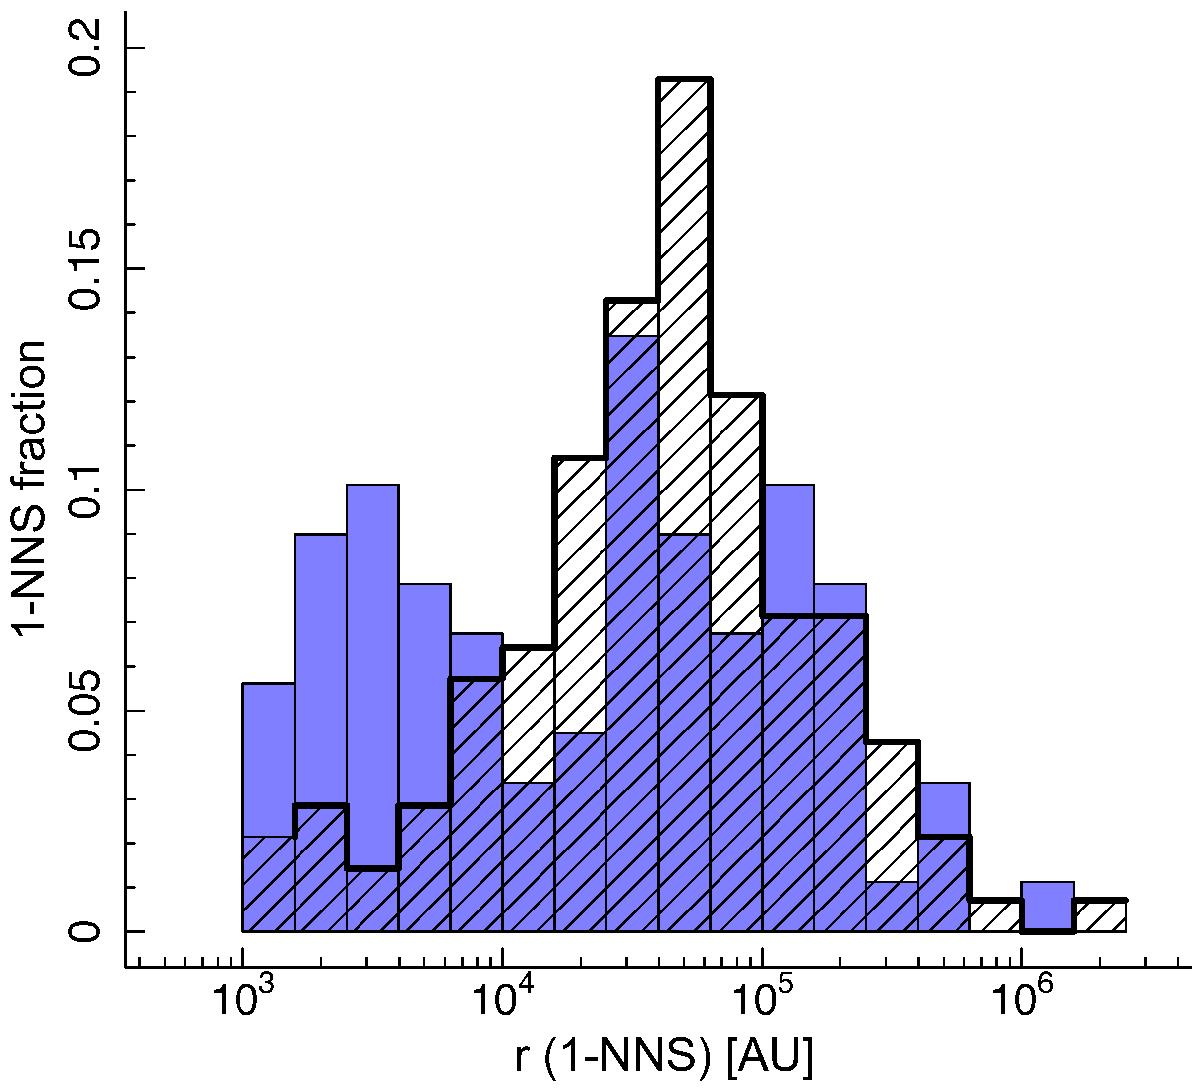
Fig. 5

First nearest neighbor separation fraction distribution of multiple systems (solid blue histogram) versus single stars (dashed black histogram) for Class II and III objects observed at high angular resolution (HAR) in Taurus region. Each bin represents the number density of stars per unit logarithmic interval in projected separation, that is, the number density fraction of 1-NNS per (Δlog r = 0.2) interval. There is a marked excess of 1-NNS in the range 1−10 kAU for the multiple systems with respect to single stars.
Current usage metrics show cumulative count of Article Views (full-text article views including HTML views, PDF and ePub downloads, according to the available data) and Abstracts Views on Vision4Press platform.
Data correspond to usage on the plateform after 2015. The current usage metrics is available 48-96 hours after online publication and is updated daily on week days.
Initial download of the metrics may take a while.


