Fig. 4
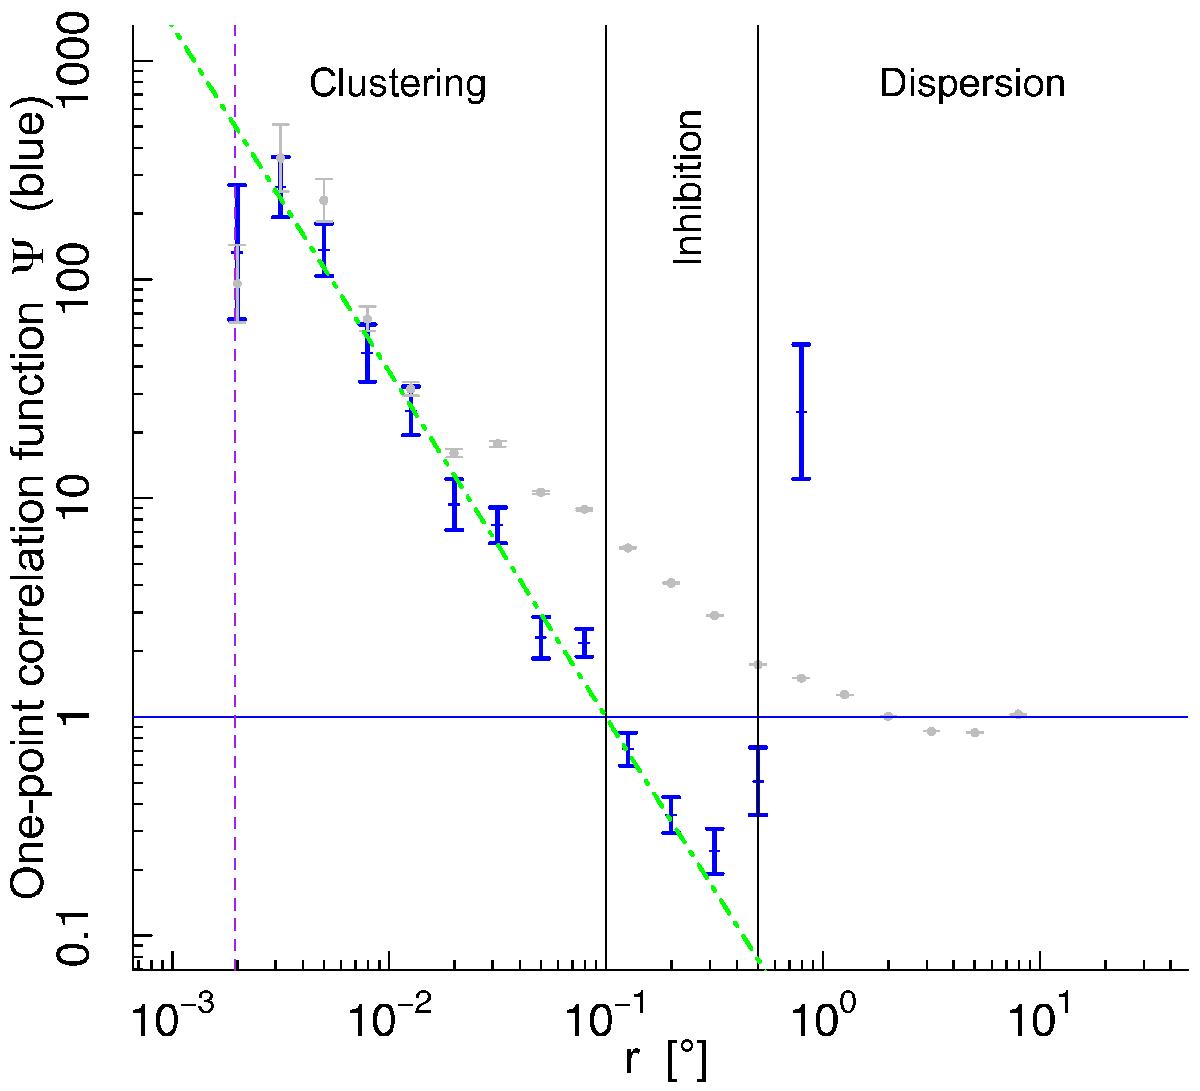
One-point correlation function Ψ (Eq. (7), blue symbols) and estimated pair correlation function g (gray symbols) using the sample of stars within Win. The pair correlation function has been estimated using the estimator given in Eq. (6) while performing 10 000 random Monte Carlo samplings within Win. The 1σ vertical errorbars of Ψ and g are estimated from Poisson statistics. The solid horizontal blue line represents both the constant Ψ = 1 and ĝ = 1 functions, that is, the one-point and pair correlation function expected for a spatial random distribution. Vertical black solid lines delimit three spatial regimes, clustering, inhibition, and dispersion, derived from the crossing of the Taurus Ψ function with the Ψ = 1 horizontal line associated to random spatial distribution. The vertical dashed purple line indicates the 7′′ spacing threshold used to group stars into a unique multiple system. The dotted-dashed green line is the Ψ ∝ r-1.5 function resulting from a linear regression fit taking into account vertical errorbars over ten 1-NNS logarithm bins (Δlog r = 0.2). The Ψ function may reveal an extended binary regime from 1.6 kAU to 100 kAU in Taurus, which has remained unidentified beyond approximately 5 kAU in previous works that used the pair correlation function alone, since the latter reveals a power law break around that separation.
Current usage metrics show cumulative count of Article Views (full-text article views including HTML views, PDF and ePub downloads, according to the available data) and Abstracts Views on Vision4Press platform.
Data correspond to usage on the plateform after 2015. The current usage metrics is available 48-96 hours after online publication and is updated daily on week days.
Initial download of the metrics may take a while.