Fig. 3
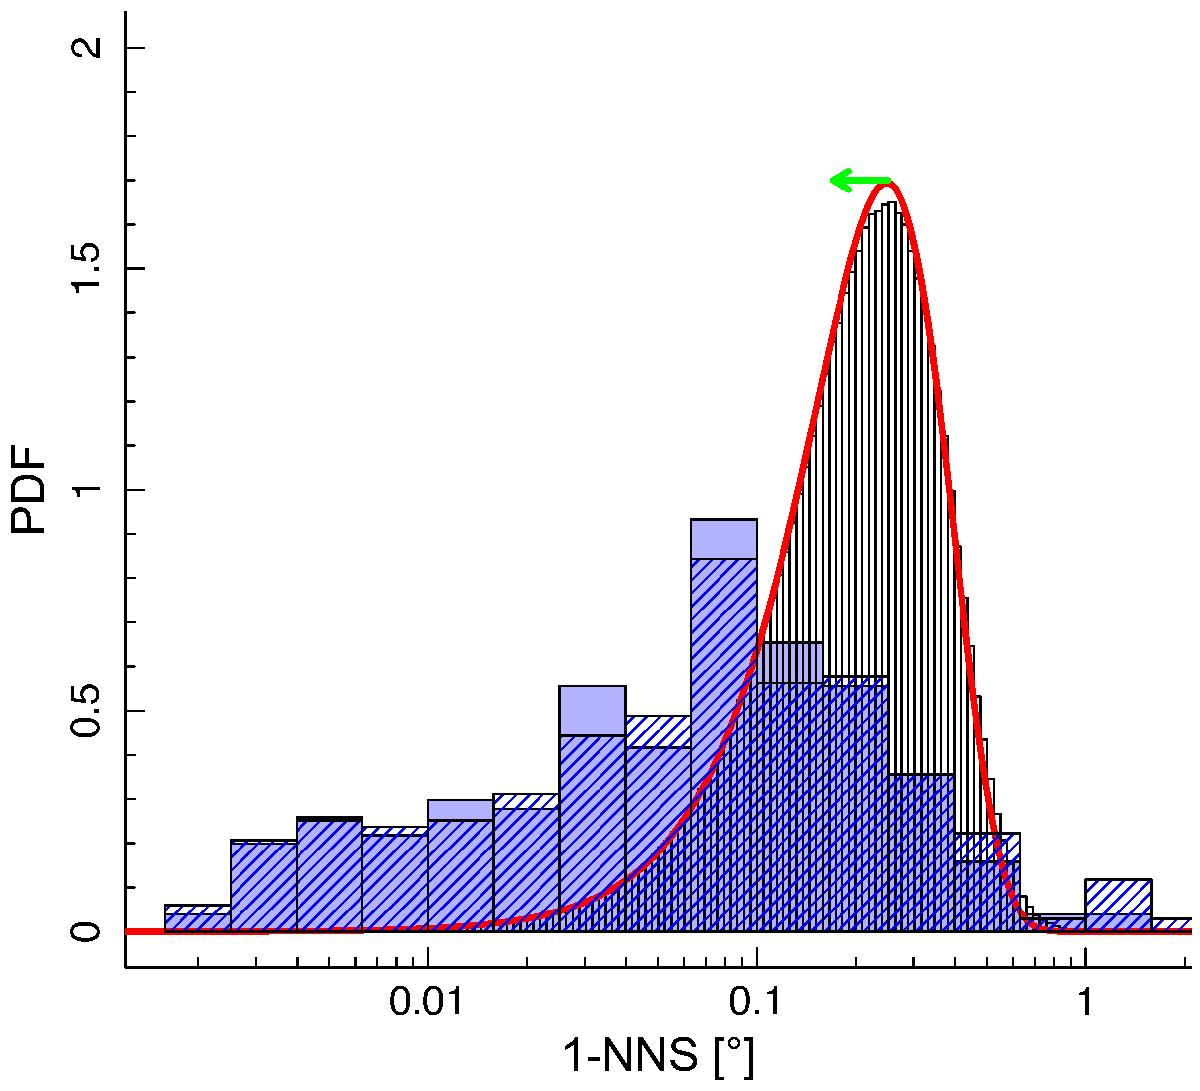
Probability distribution function (PDF) of the 1-NNS distributions observed in Taurus (solid blue histogram: within the limited window Win, that is, the three main filaments; dashed blue histogram: the entire Taurus region) and predicted for a random distribution (black histogram: for a Monte Carlo sampling within the window Win; red curve: unlimited theoretical random 1-NNS distribution, see Eq. (3)). Both random populations are drawn using the same mean surface density ρw = 5deg2. Increasing the mean density by a factor of two leads to a shift towards the left whose amplitude is represented by the green arrow. The Monte Carlo sampling in a finite window and the unlimited theoretical random 1-NNS do not significantly differ. The 1-NNS distributions computed either in the whole Taurus or within Win do not significantly differ either. However, the Taurus and random 1-NNS distributions are statistically highly inconsistent, with a p-value of ~10-16 for the KS test. The spatial distribution in Taurus is clearly far from being random.
Current usage metrics show cumulative count of Article Views (full-text article views including HTML views, PDF and ePub downloads, according to the available data) and Abstracts Views on Vision4Press platform.
Data correspond to usage on the plateform after 2015. The current usage metrics is available 48-96 hours after online publication and is updated daily on week days.
Initial download of the metrics may take a while.