Fig. 1
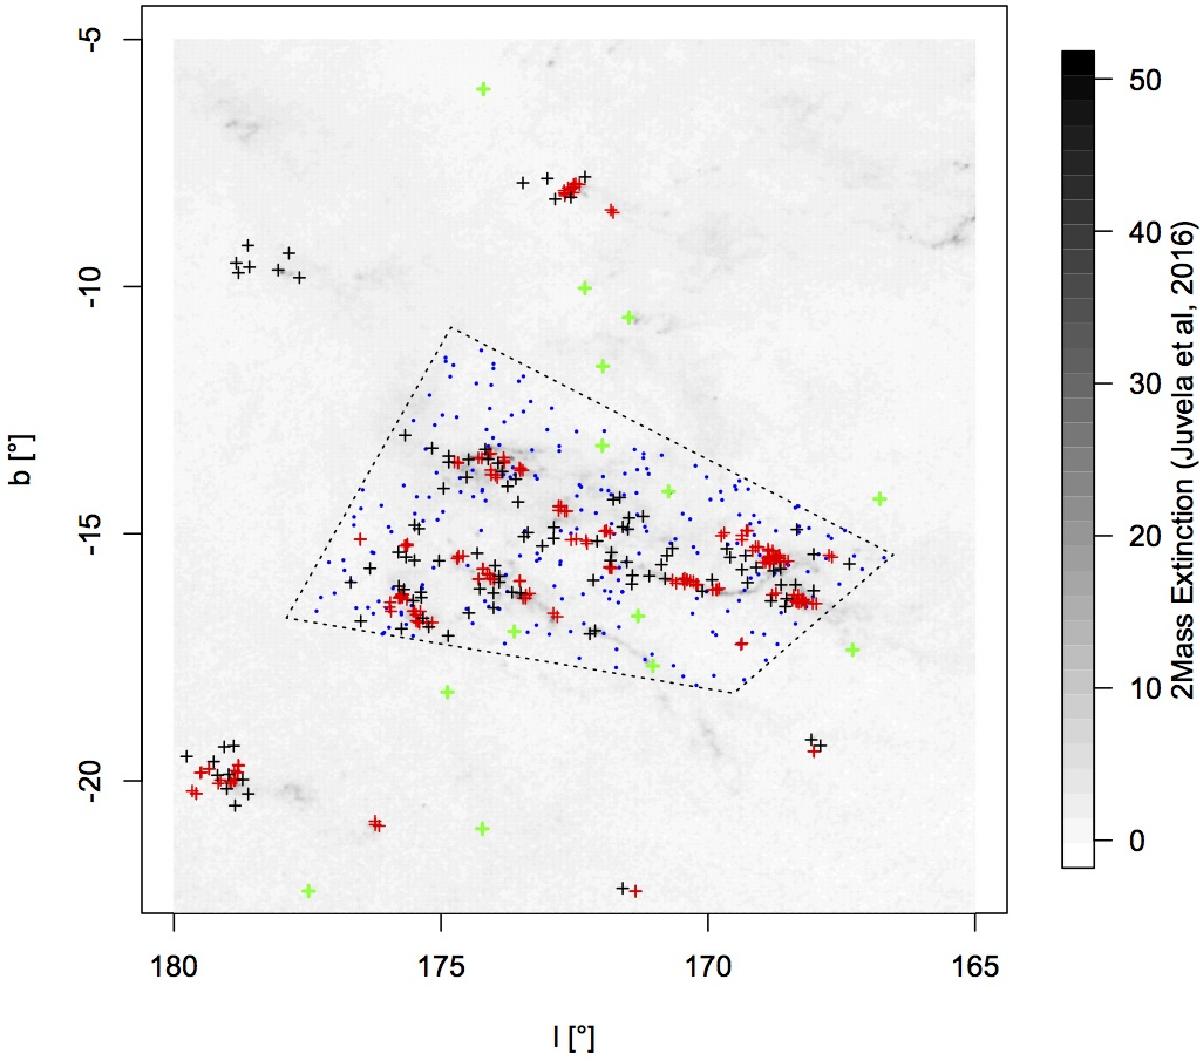
Spatial distribution of stars within the Taurus region superimposed on near-infrared extinction (unit mag, gray scale) from Juvela & Montillaud (2016). Dashed polygon: restricted spatial window Win in Taurus complex; blue filled dots: random sampling. Color-coding for Taurus stars: red plus marks: clustered stars [1-NNS ≤ 0.1°]; black plus marks: “inhibited” regime stars [0.1°< 1-NNS ≤ 0.55°]; green plus marks: isolated stars [1-NNS beyond 0.55°] (see Sect. 3).
Current usage metrics show cumulative count of Article Views (full-text article views including HTML views, PDF and ePub downloads, according to the available data) and Abstracts Views on Vision4Press platform.
Data correspond to usage on the plateform after 2015. The current usage metrics is available 48-96 hours after online publication and is updated daily on week days.
Initial download of the metrics may take a while.