Free Access
Fig. A.2
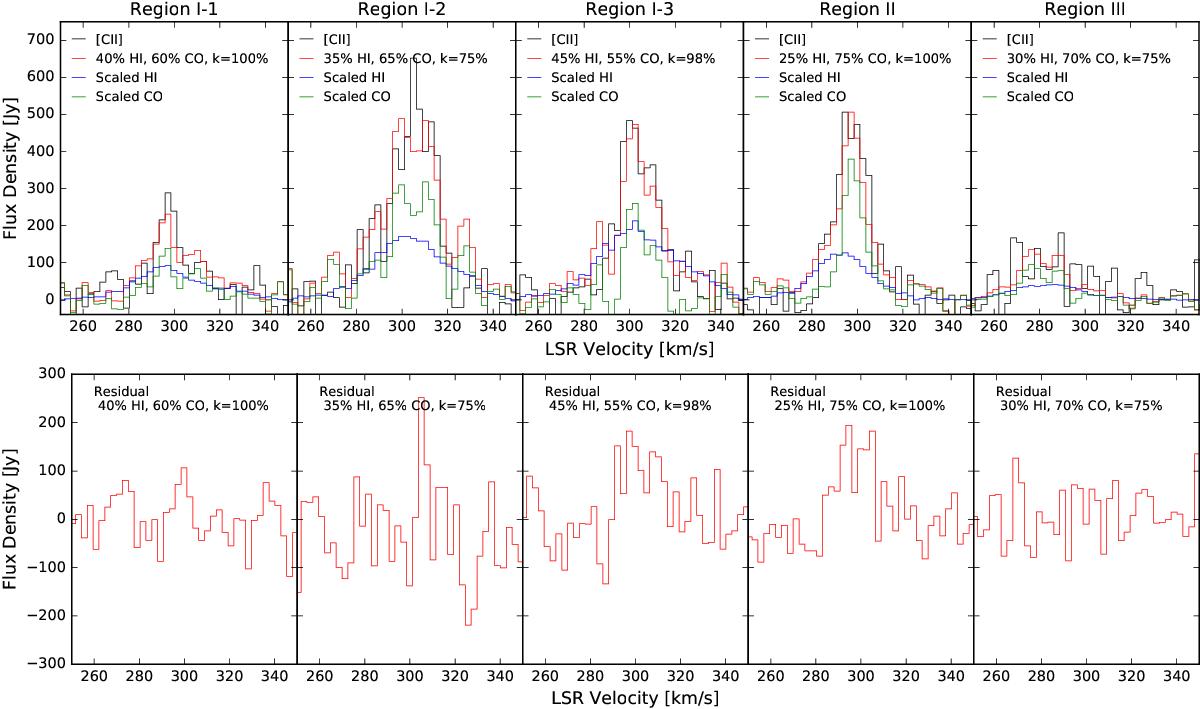
Channel method decomposition. Upper row: original [C ii] spectra in black and the best fitting synthetic spectra in red with the weightings given in Table A.1. The accordingly scaled H i spectra are shown in blue, CO(2 → 1) in green. Bottom row: residuals computed from the weighted spectra by subtraction from [C ii] data.
This figure is made of several images, please see below:
Current usage metrics show cumulative count of Article Views (full-text article views including HTML views, PDF and ePub downloads, according to the available data) and Abstracts Views on Vision4Press platform.
Data correspond to usage on the plateform after 2015. The current usage metrics is available 48-96 hours after online publication and is updated daily on week days.
Initial download of the metrics may take a while.