Free Access
Fig. 4
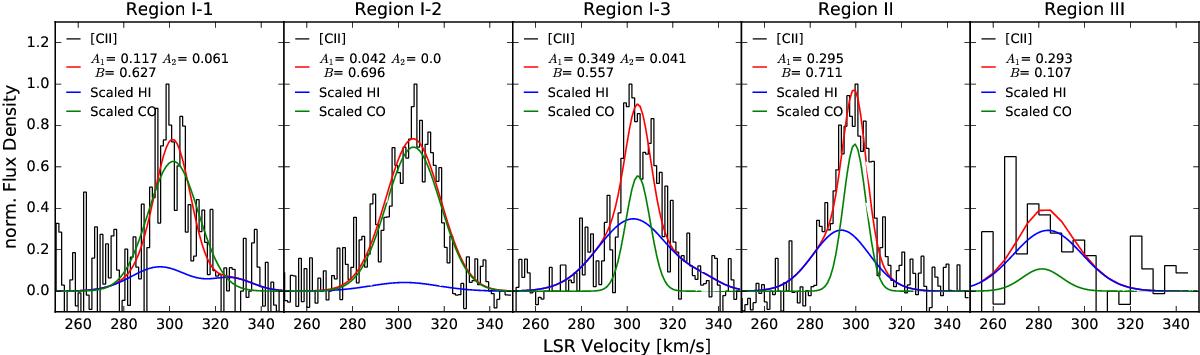
Gaussian fit method. [C ii] spectra in the five pointings fitted with Gaussian curves as described by Eq. (1). In region II and III we only fit two Gaussian curves, but in the pointings of region I we use two H i components. The [C ii] spectra in region III was rebinned to 5 km s-1.
Current usage metrics show cumulative count of Article Views (full-text article views including HTML views, PDF and ePub downloads, according to the available data) and Abstracts Views on Vision4Press platform.
Data correspond to usage on the plateform after 2015. The current usage metrics is available 48-96 hours after online publication and is updated daily on week days.
Initial download of the metrics may take a while.