Fig. 2
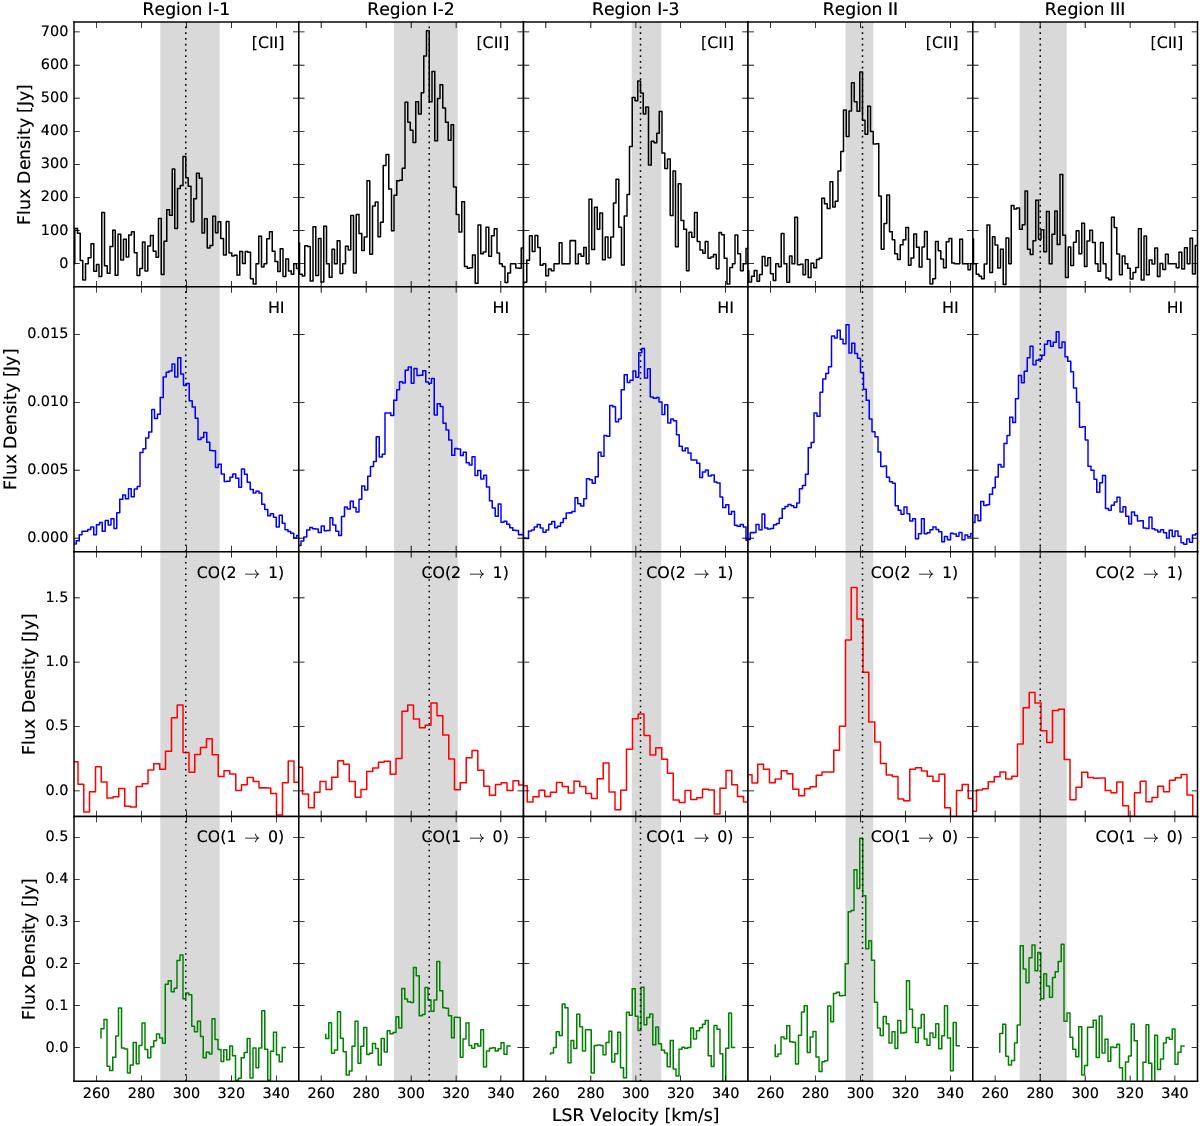
Emission spectra of SOFIA/GREAT [C ii] and ancillary CO and H i in the five positions in NGC 4214. The spectra shown are based on the data that were spatially convolved with Gaussian kernels to the resolution of the SOFIA data (14′′). The vertical lines indicate the channel with maximum [C ii] emission, except for region III where it indicates the center of the broad profile. The gray-shaded areas indicate the FWHM ranges around the CO-peak positions. The original velocity resolutions shown here are 1.16 km s-1, 1.29 km s-1, 2.6 km s-1, and 1.30 km s-1 for [C ii], H i, CO(2 → 1), and CO(1 → 0), respectively.
Current usage metrics show cumulative count of Article Views (full-text article views including HTML views, PDF and ePub downloads, according to the available data) and Abstracts Views on Vision4Press platform.
Data correspond to usage on the plateform after 2015. The current usage metrics is available 48-96 hours after online publication and is updated daily on week days.
Initial download of the metrics may take a while.