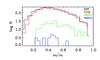
Fig. 9
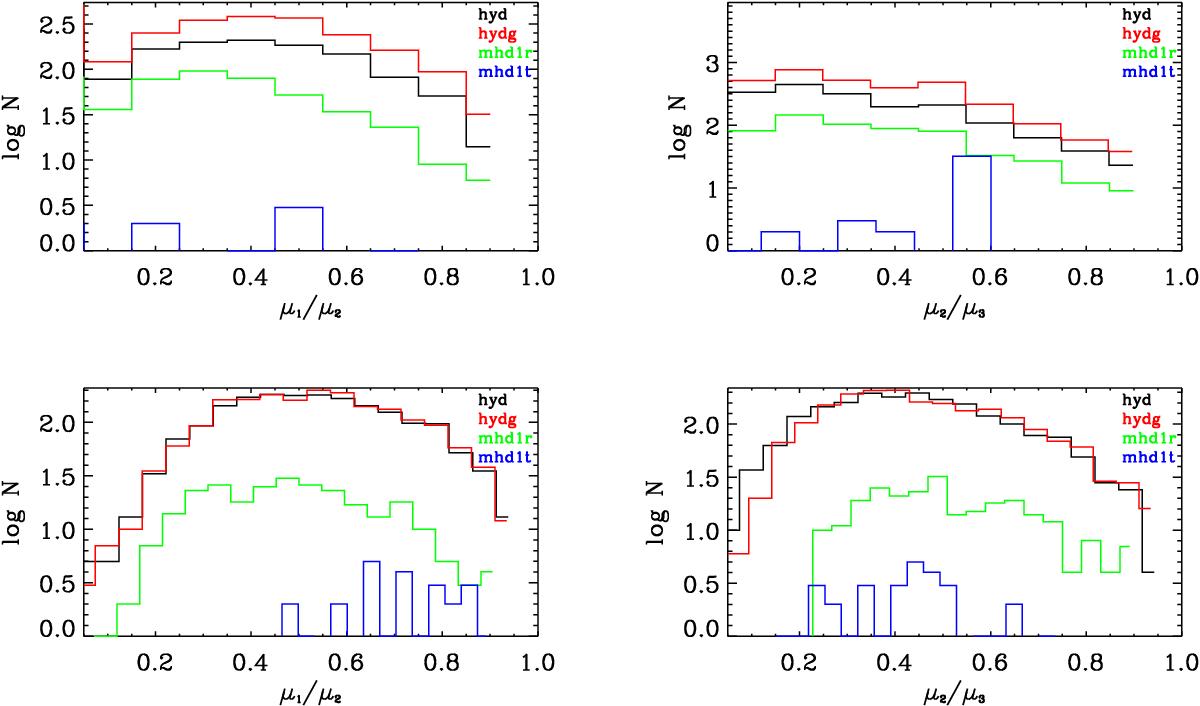
Clump axis ratio distribution in runs hyd, hydg, mhd1r, and mhd1t at about 2 Myr (top), and at the end of each run (bottom). The end of runs hyd, hydg, and mhd1r is at about 6 Myr, and the end of run mhd1t is at about 7 Myr. The histograms on the left show the ratio of the shortest (μ1) to the second longest (μ2) dimension of the structure, and those on the right show the ratio of the second longest to the longest (μ3) dimension of the structure. Clumps containing less than 10 cells are not shown.
Current usage metrics show cumulative count of Article Views (full-text article views including HTML views, PDF and ePub downloads, according to the available data) and Abstracts Views on Vision4Press platform.
Data correspond to usage on the plateform after 2015. The current usage metrics is available 48-96 hours after online publication and is updated daily on week days.
Initial download of the metrics may take a while.