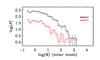
Fig. 8
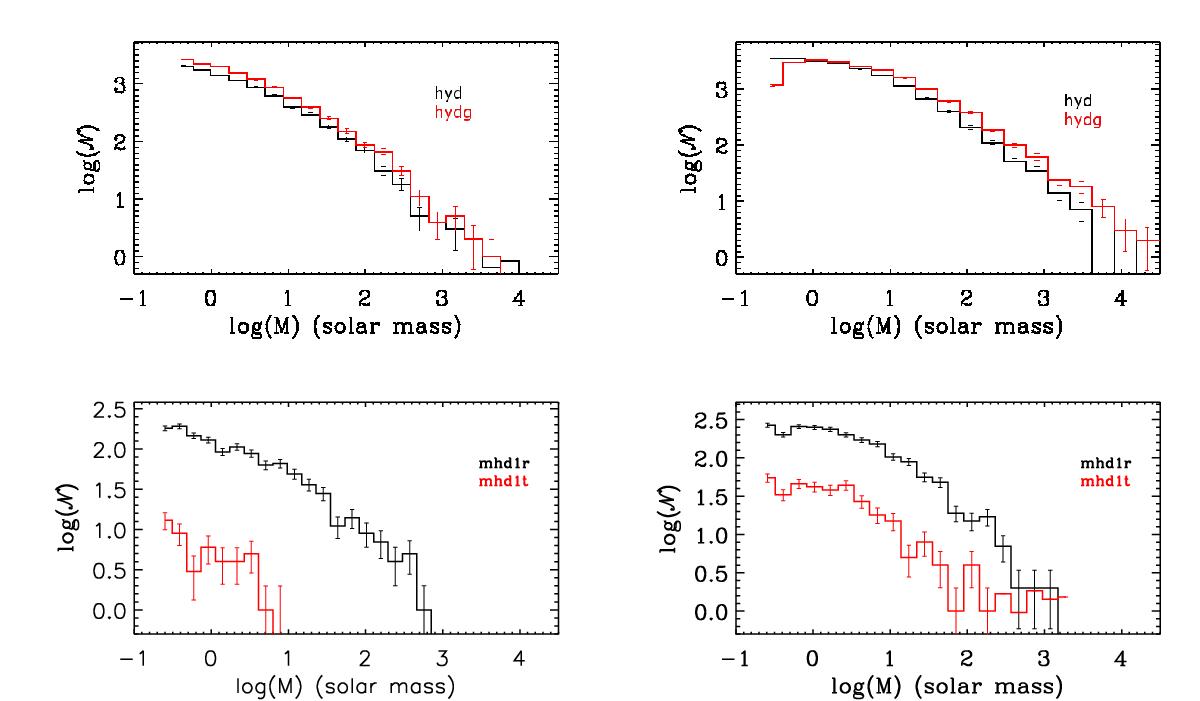
Distributions of the cold clump masses, defined as “friends-of-friends” groups above a density threshold of 50 cm-3, for different simulations. Top panel: hyd (black histogram); hydg (red histogram). Bottom panel: mhd1r (black histogram); mhd1t (red histogram). Snapshots were taken at times t = 2 Myr (left) and t = 6 Myr (right).
Current usage metrics show cumulative count of Article Views (full-text article views including HTML views, PDF and ePub downloads, according to the available data) and Abstracts Views on Vision4Press platform.
Data correspond to usage on the plateform after 2015. The current usage metrics is available 48-96 hours after online publication and is updated daily on week days.
Initial download of the metrics may take a while.