Fig. 6
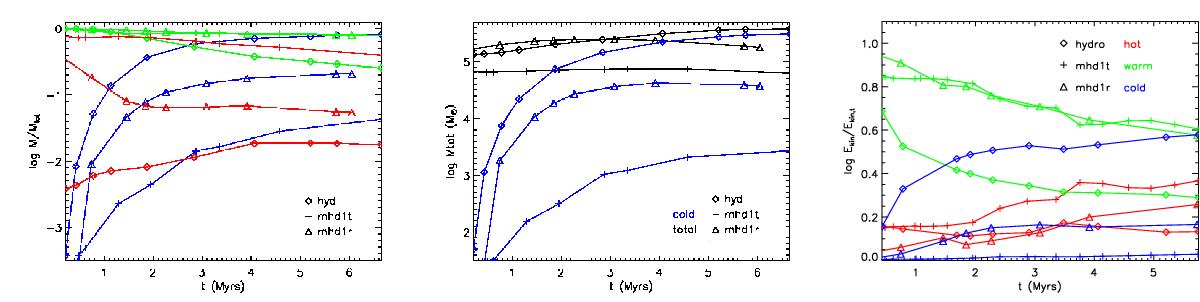
Logarithm of gas mass fractions (left), absolute gas masses (middle), and kinetic energy fractions (right) per gas phase as a function of time. The diamond shapes correspond to run hyd, the crosses correspond to run mhdr, and the triangles to run mhdt. Blue indicates temperatures below 100 K, green temperatures 100 <T ≤ 10 000 K, and red temperatures above 10 000 K. The black curves in the middle panel show the total mass in the computational box.
Current usage metrics show cumulative count of Article Views (full-text article views including HTML views, PDF and ePub downloads, according to the available data) and Abstracts Views on Vision4Press platform.
Data correspond to usage on the plateform after 2015. The current usage metrics is available 48-96 hours after online publication and is updated daily on week days.
Initial download of the metrics may take a while.