Fig. 4
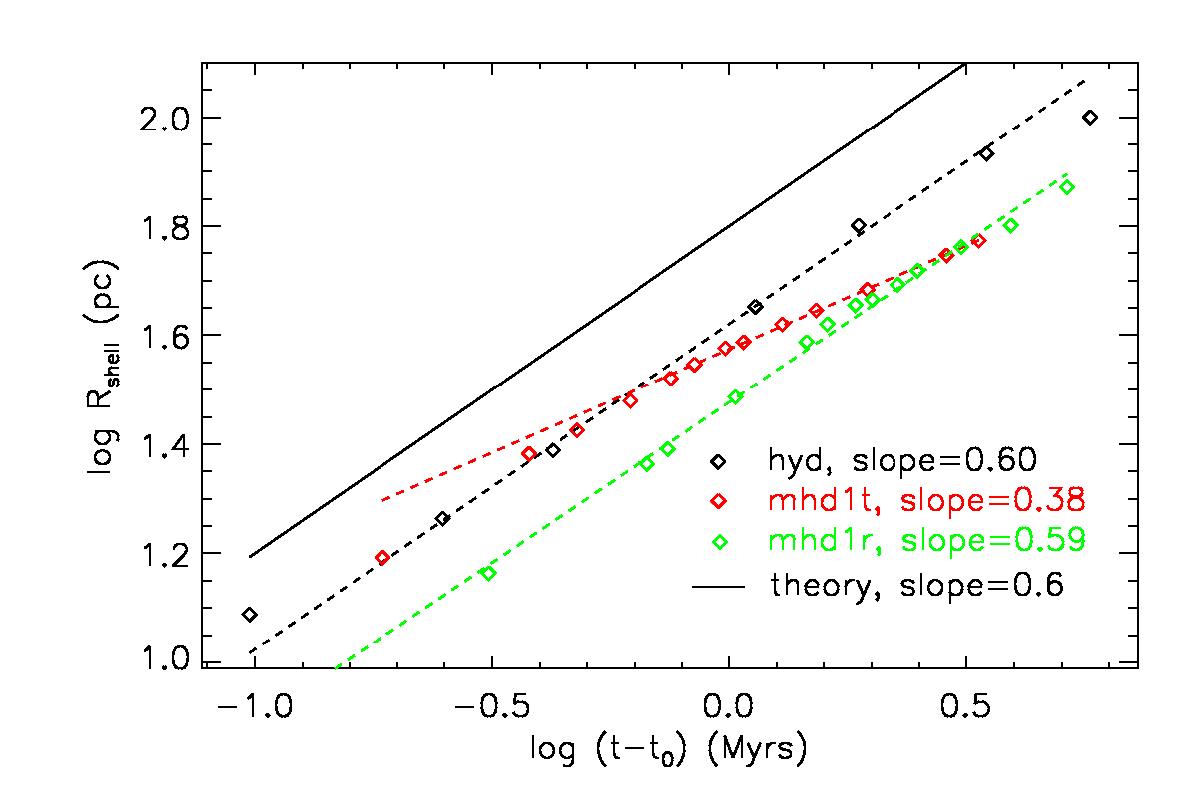
Logarithm of the average shell radius vs. logarithm of time for the different models. Time is plotted relative to the first available snapshot for each run at about 0.2 Myr. The dashed lines are linear fits with the slope mentioned on the bottom right of the plot. The analytical radius-time relation, R(t) ∝ t3/5, almost coincides with the black dashed line; the offset with respect to the dashed lines was introduced for illustration purposes.
Current usage metrics show cumulative count of Article Views (full-text article views including HTML views, PDF and ePub downloads, according to the available data) and Abstracts Views on Vision4Press platform.
Data correspond to usage on the plateform after 2015. The current usage metrics is available 48-96 hours after online publication and is updated daily on week days.
Initial download of the metrics may take a while.