Fig. 3
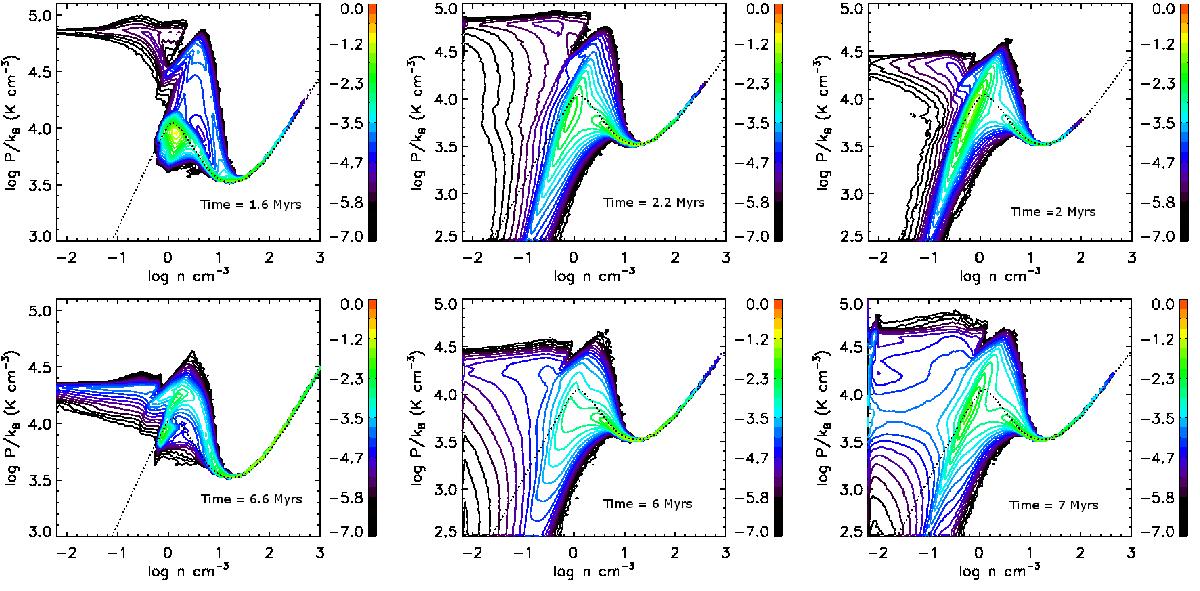
Two-dimensional mass histogram in pressure and density bins for runs hyd (left; run hydg is almost identical), mhd1r (middle), and mhd1t (right). Top panels: early phase (before the collision). Bottom panels: late phase of the collision at the end of the simulation. The color bars show the mass fraction in each bin and the dotted line indicates the cooling-heating equilibrium curve from the cooling function implemented in the code.
Current usage metrics show cumulative count of Article Views (full-text article views including HTML views, PDF and ePub downloads, according to the available data) and Abstracts Views on Vision4Press platform.
Data correspond to usage on the plateform after 2015. The current usage metrics is available 48-96 hours after online publication and is updated daily on week days.
Initial download of the metrics may take a while.