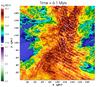
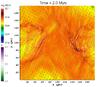
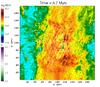
Fig. 2
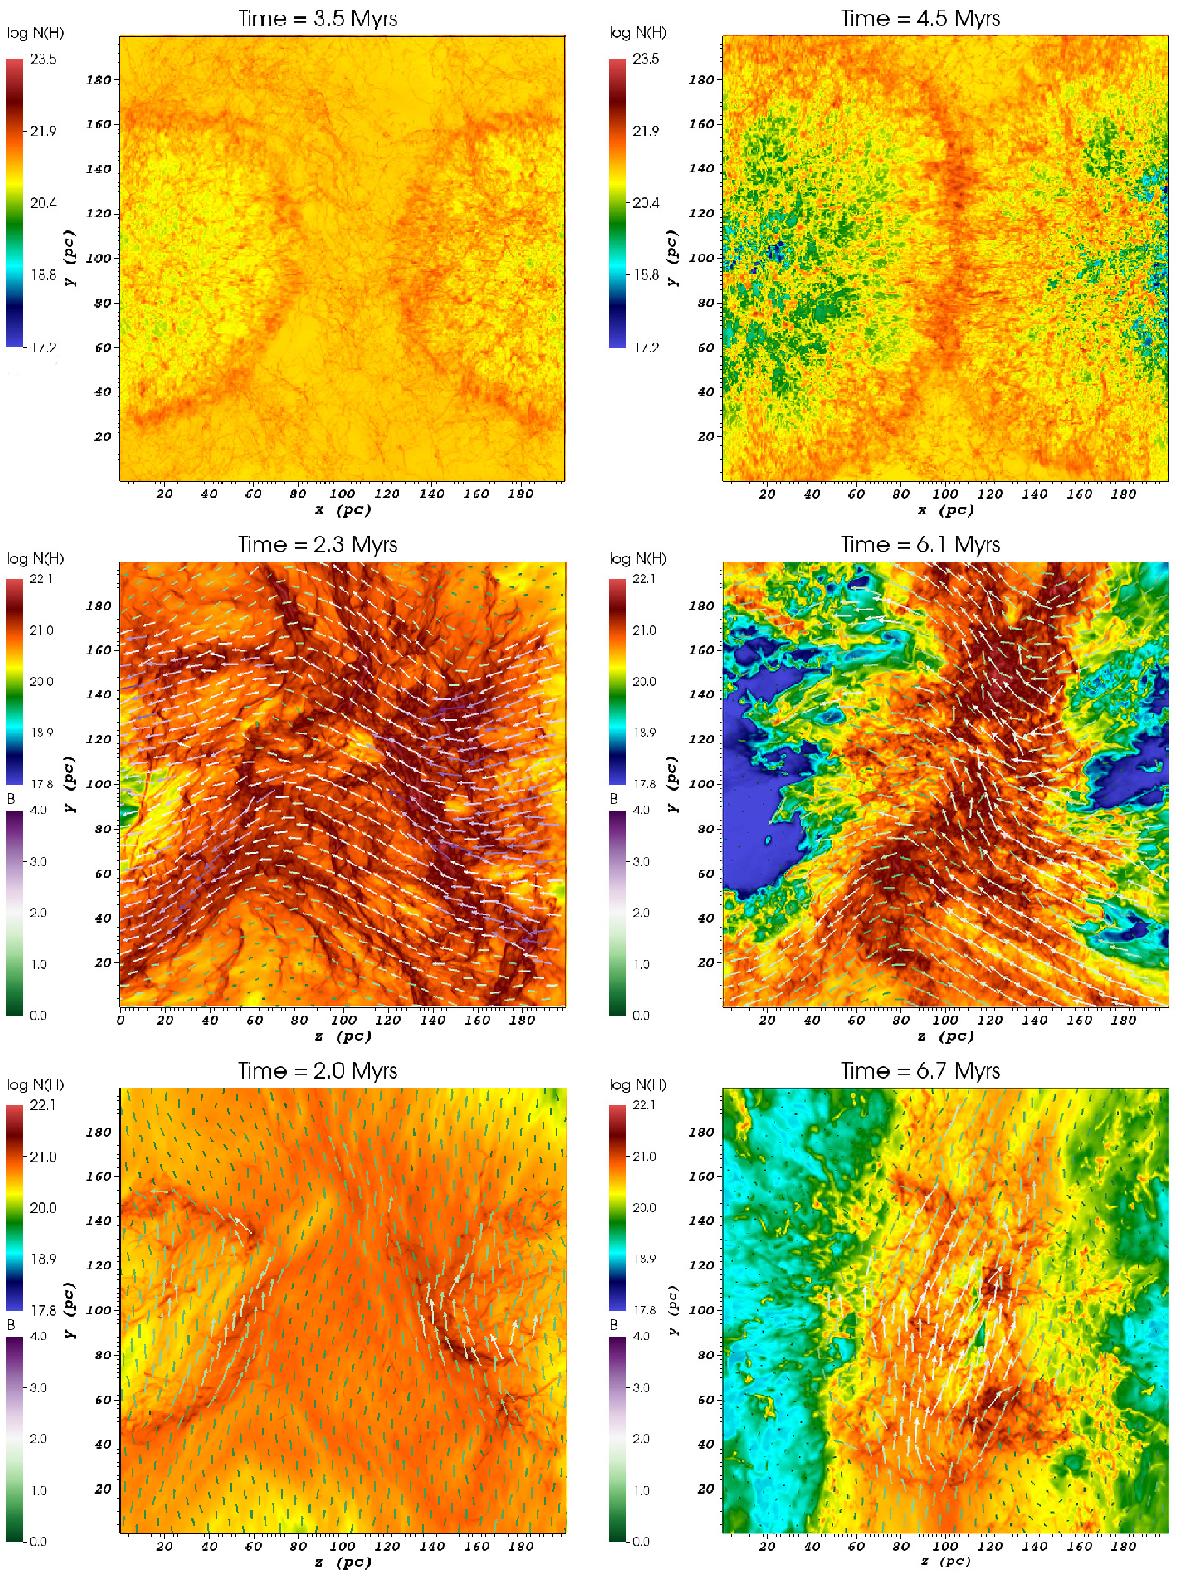
Column density contours for the pure hydrodynamic run hyd (top) and the two MHD runs, mhd1r (middle) and mhd1t (bottom). In runs mhd1r and mhd1t the collision occurs along the z-axis. The initial magnetic field of run mhd1r is also along the z-axis, while that of mhd1t is along the y-axis. Time increases from left to right, as indicated in the plot labels. The mass-weighted projected magnetic field is shown with arrows, color coded according to its magnitude in μG.
Current usage metrics show cumulative count of Article Views (full-text article views including HTML views, PDF and ePub downloads, according to the available data) and Abstracts Views on Vision4Press platform.
Data correspond to usage on the plateform after 2015. The current usage metrics is available 48-96 hours after online publication and is updated daily on week days.
Initial download of the metrics may take a while.