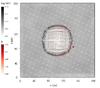
Fig. A.1
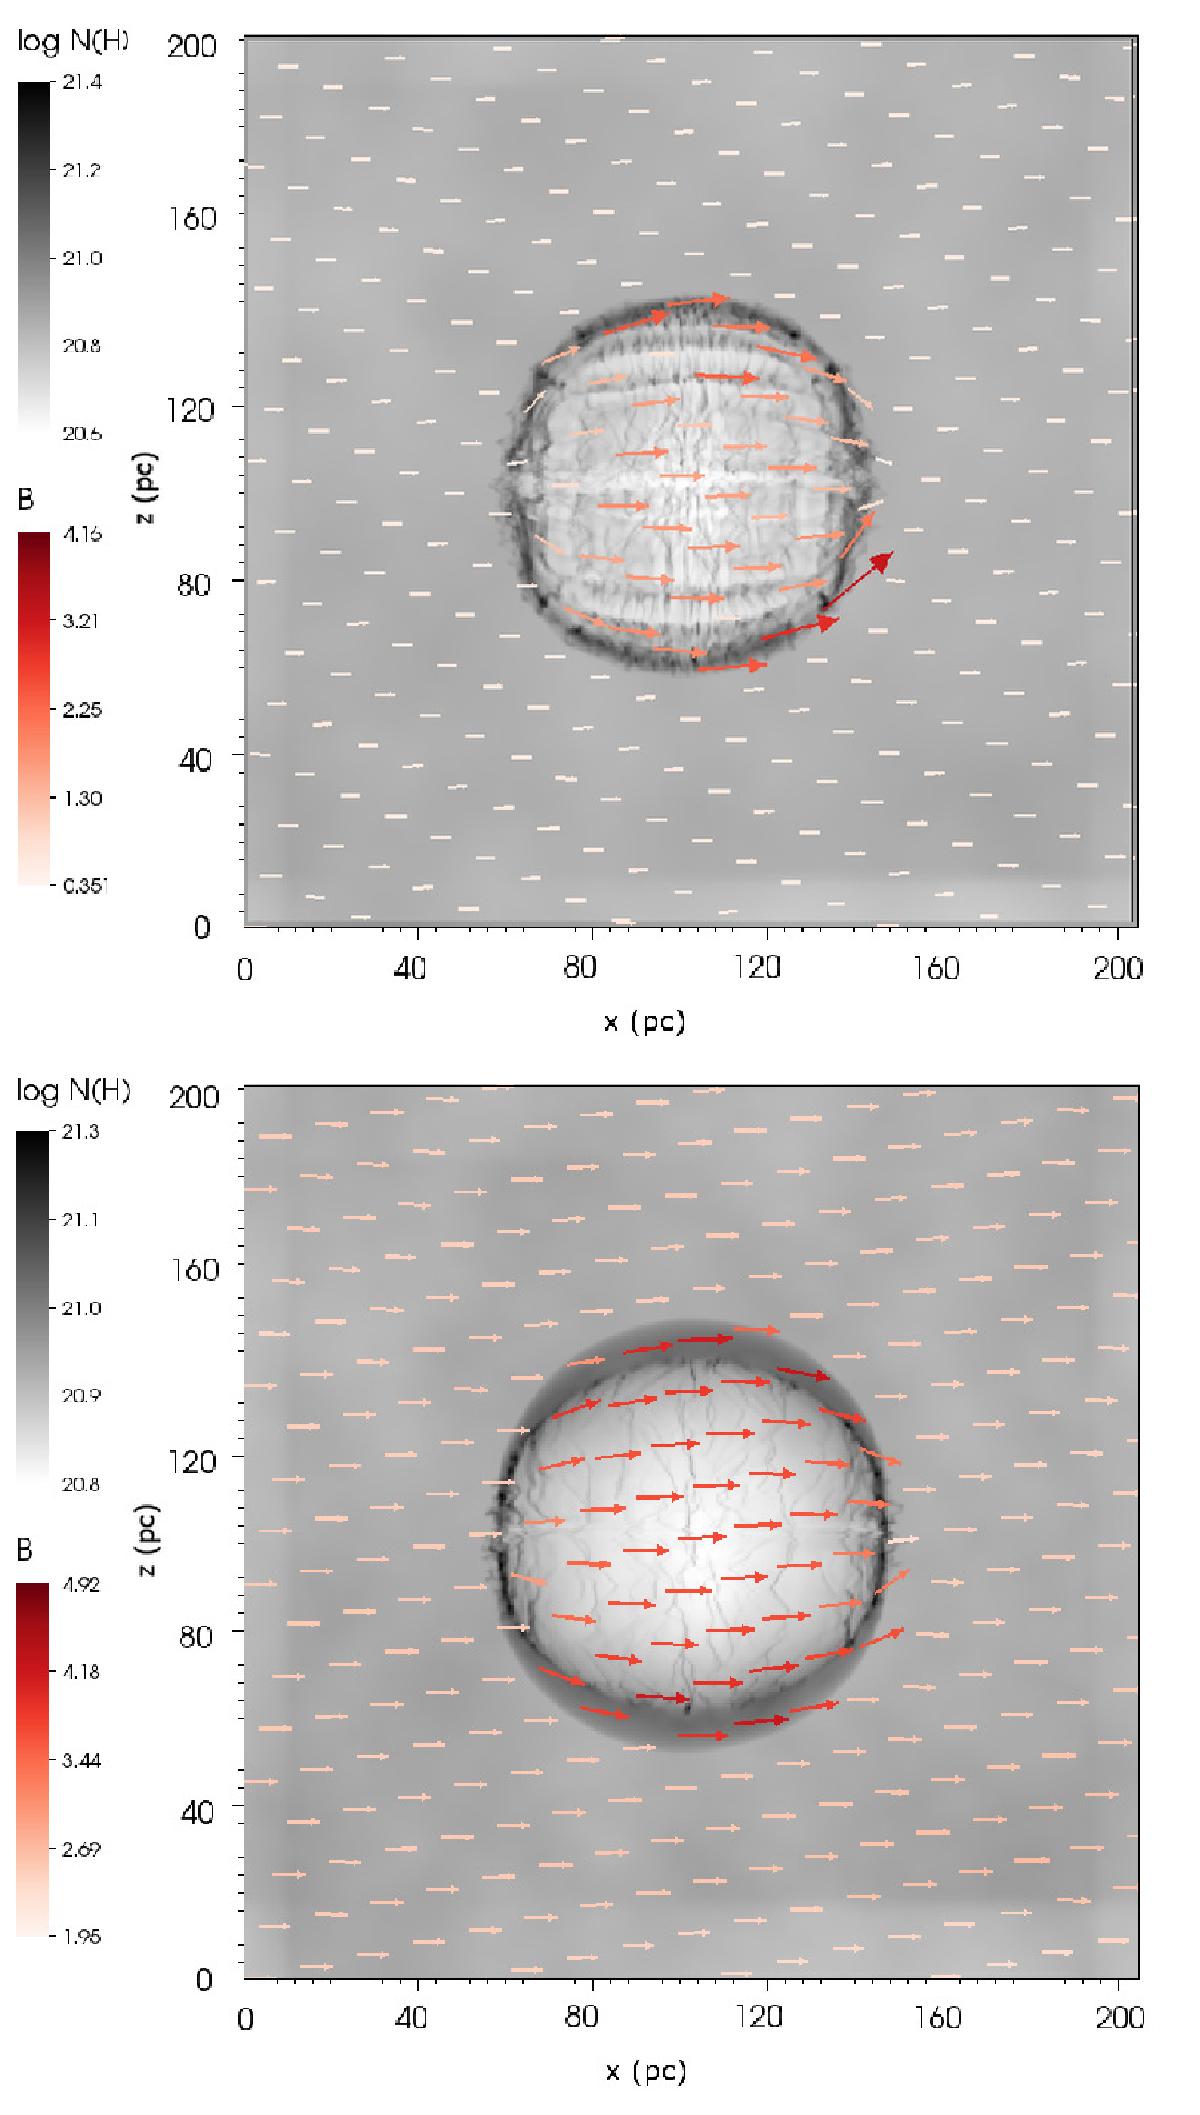
Expansion of a single bubble in a low magnetic field (top, plasma β = 10) and high magnetic field (bottom, plasma β = 1, analogous to runs mhd1r and mhd1t, but with much lower levels of turbulence). The image in gray scale is the logarithm of the hydrogen column density in log (cm-2) and the arrows show the projected magnetic field, color coded according to its magnitude in μG. The plots correspond to t = 0.2 Myr for both simulations.
Current usage metrics show cumulative count of Article Views (full-text article views including HTML views, PDF and ePub downloads, according to the available data) and Abstracts Views on Vision4Press platform.
Data correspond to usage on the plateform after 2015. The current usage metrics is available 48-96 hours after online publication and is updated daily on week days.
Initial download of the metrics may take a while.