Free Access
Fig. 12
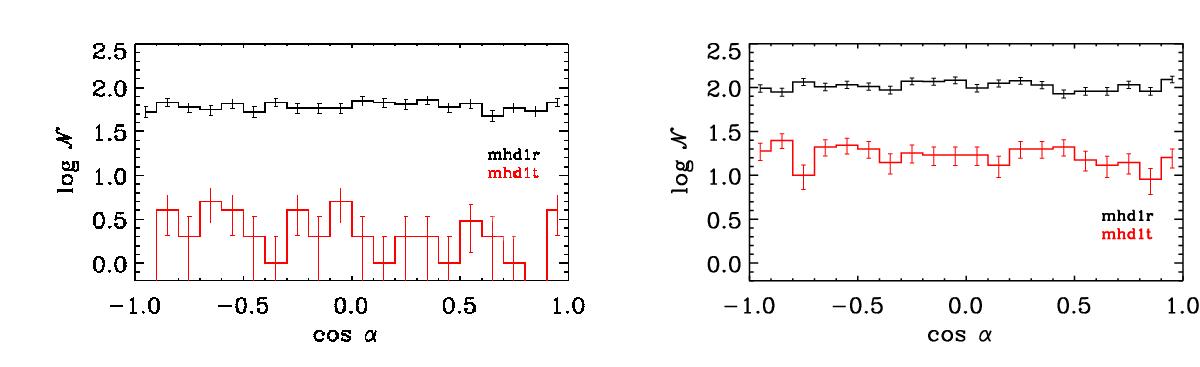
Distribution of the cosine of the angle between the main axis of the filament in three dimensions and the mean local magnetic field, at times t = 2 Myr (left) and t = 6 Myr (right) for runs mhd1r (black) and mhd1t (red). Filaments are defined as described in the text and in the figures above.
This figure is made of several images, please see below:
Current usage metrics show cumulative count of Article Views (full-text article views including HTML views, PDF and ePub downloads, according to the available data) and Abstracts Views on Vision4Press platform.
Data correspond to usage on the plateform after 2015. The current usage metrics is available 48-96 hours after online publication and is updated daily on week days.
Initial download of the metrics may take a while.