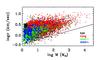
Fig. 10
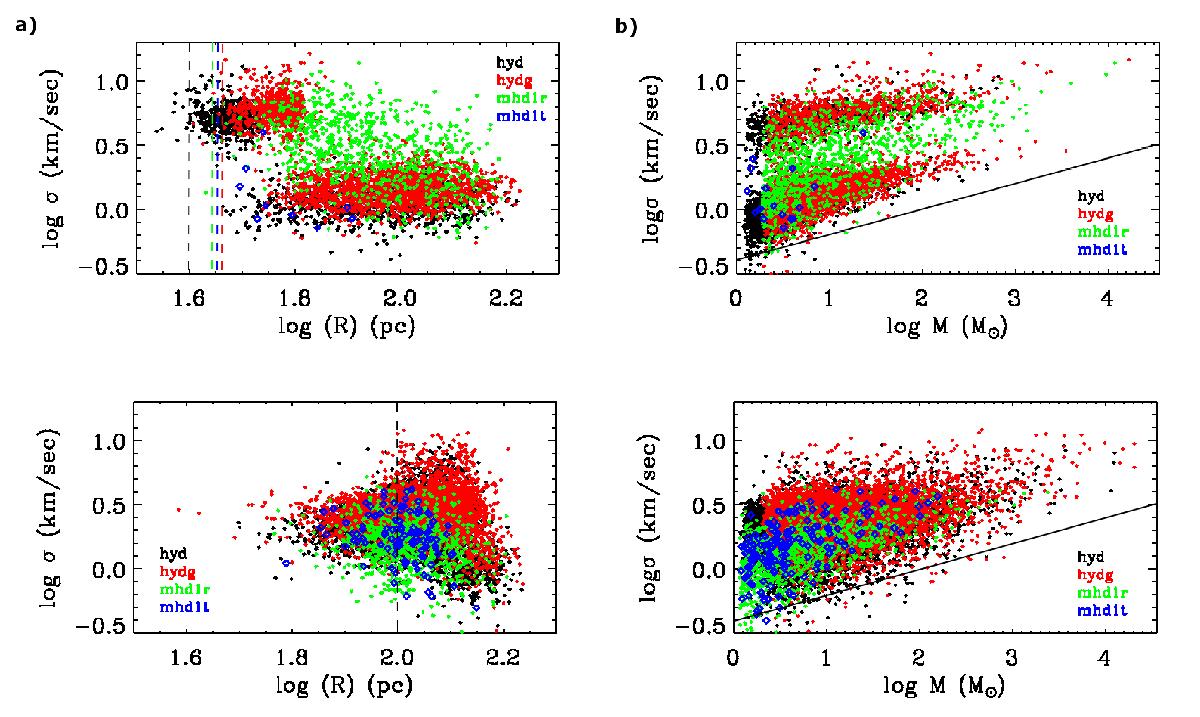
a) Three-dimensional velocity dispersion of the dense structures as function of the distance from the closest superbubble, shown before the collision and at the end of the simulations. The dashed lines show the mean radius of the bubbles in each run. Bottom plot: snapshots after the collision, so there is only one dashed line, which indicates the middle of the box. b) Three-dimensional velocity dispersion of the dense structures as a function of their mass. The solid line shows the Larson relation σ (km s-1) = 0.4 M (M⊙)0.2 (Larson 1981). Both panels the top plots: times before the collision (t = 2 Myr for runs hyd, 2.2 Myr for runs hydg, mhd1r, and mhd1t), and the bottom plots show times after the collision (t = 7.6 Myr for run mhd1t, t = 6 Myr for runs hyd, hydg, and mhd1r). Runs hyd and hydg are shown at slightly different times to avoid overlapping of the points.
Current usage metrics show cumulative count of Article Views (full-text article views including HTML views, PDF and ePub downloads, according to the available data) and Abstracts Views on Vision4Press platform.
Data correspond to usage on the plateform after 2015. The current usage metrics is available 48-96 hours after online publication and is updated daily on week days.
Initial download of the metrics may take a while.