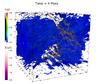
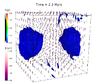
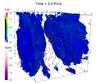
Fig. 1
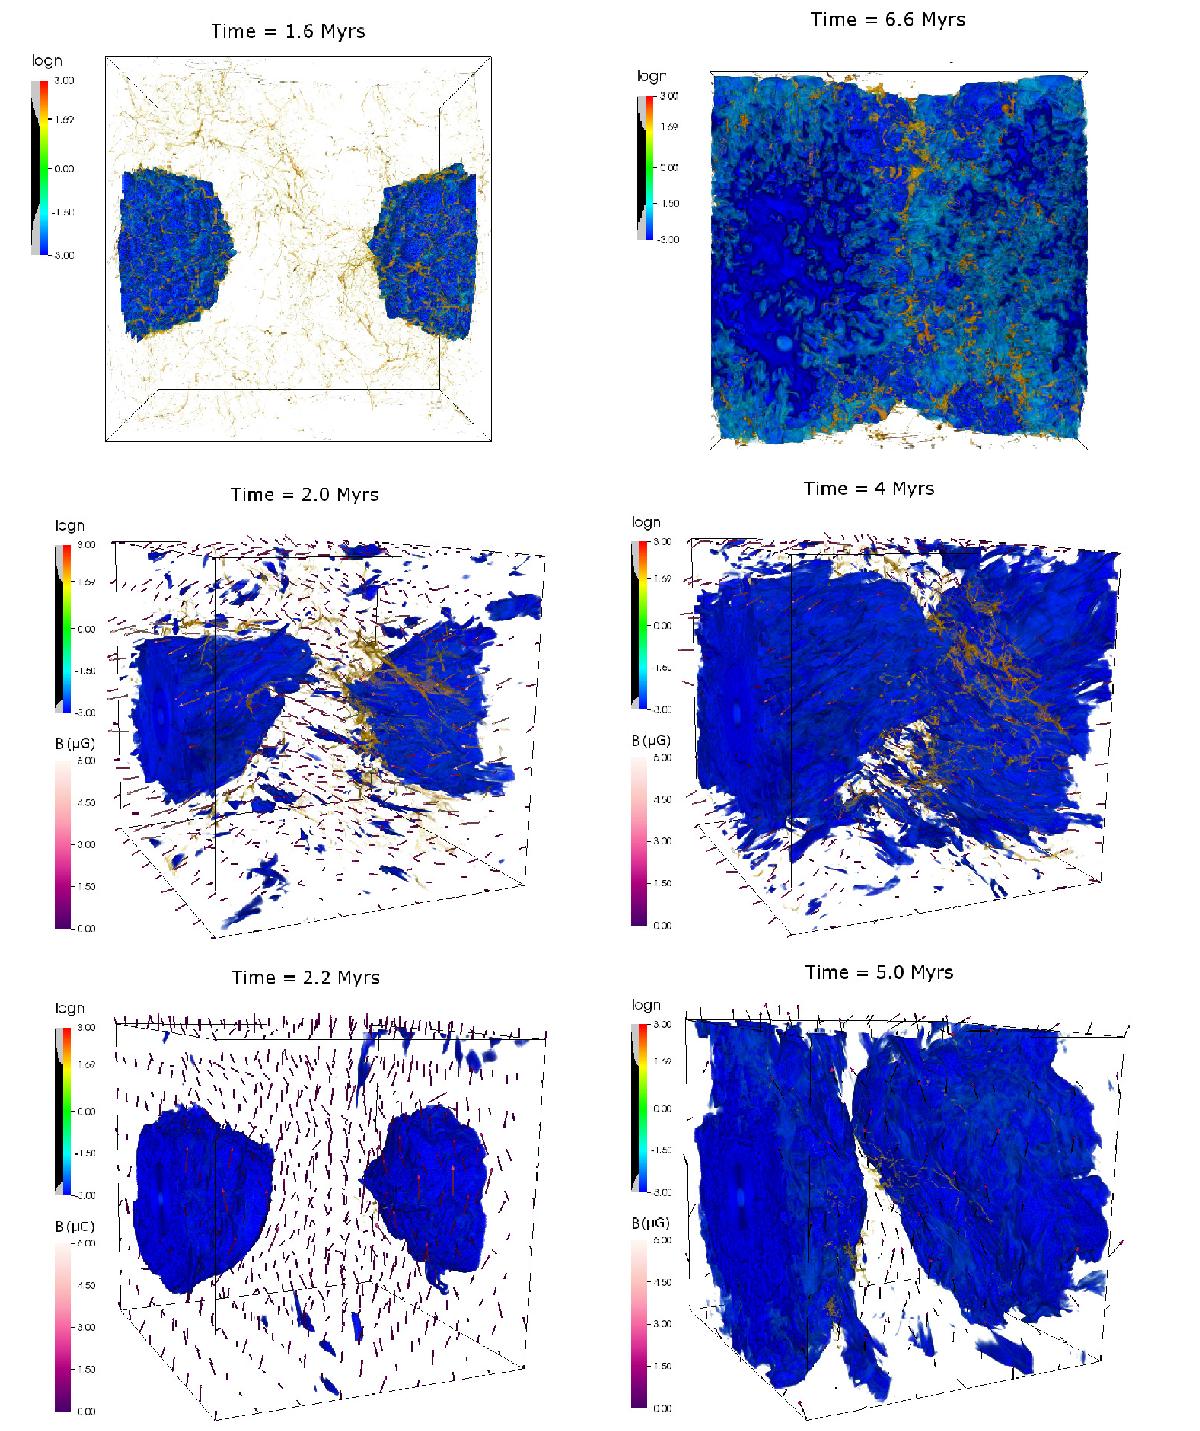
Volume rendering of the logarithm of the density field in the hydrodynamical run hyd (top), and the two MHD runs, mhd1r (middle), and mhd1t (bottom). Time increases from left to right, as indicated in the plot labels. The warm medium was rendered transparent below 50 cm-3 to allow a clear view of the dense clumps. Transparency is indicated by the gray/black curve along the color bar.
Current usage metrics show cumulative count of Article Views (full-text article views including HTML views, PDF and ePub downloads, according to the available data) and Abstracts Views on Vision4Press platform.
Data correspond to usage on the plateform after 2015. The current usage metrics is available 48-96 hours after online publication and is updated daily on week days.
Initial download of the metrics may take a while.