Fig. 7
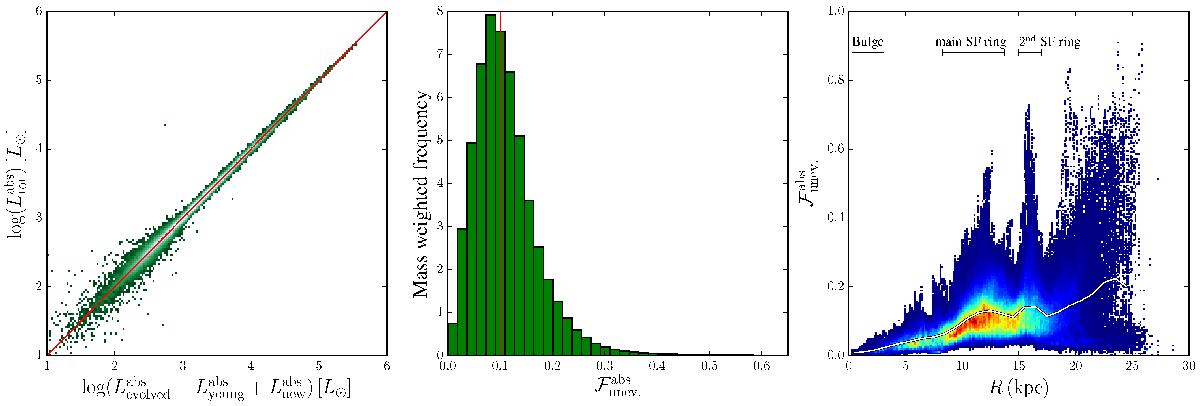
Left: 2D histogram comparing the integrated absorbed luminosity per dust cell including all stellar components ![]() with the same quantity, but as the sum of separate simulations including only evolved, young and ionising stellar populations. Middle: distribution of the bolometric absorption fraction of unevolved stellar emission per dust cell:
with the same quantity, but as the sum of separate simulations including only evolved, young and ionising stellar populations. Middle: distribution of the bolometric absorption fraction of unevolved stellar emission per dust cell: ![]() . The histogram is weighted by mass fraction of each dust cell and normalised. The red line indicates the median
. The histogram is weighted by mass fraction of each dust cell and normalised. The red line indicates the median ![]() . Right: 2D histogram showing the radial distribution of
. Right: 2D histogram showing the radial distribution of ![]() . The bins are weighted by the mass fraction of the dust cells. Red indicates a high number of data points, blue a low number. The spread at a fixed radius is a combination of dust cells at the same radius and with different vertical location in the disk. The white line is the weighted mean heating fraction per radius.
. The bins are weighted by the mass fraction of the dust cells. Red indicates a high number of data points, blue a low number. The spread at a fixed radius is a combination of dust cells at the same radius and with different vertical location in the disk. The white line is the weighted mean heating fraction per radius.
Current usage metrics show cumulative count of Article Views (full-text article views including HTML views, PDF and ePub downloads, according to the available data) and Abstracts Views on Vision4Press platform.
Data correspond to usage on the plateform after 2015. The current usage metrics is available 48-96 hours after online publication and is updated daily on week days.
Initial download of the metrics may take a while.