Fig. 3
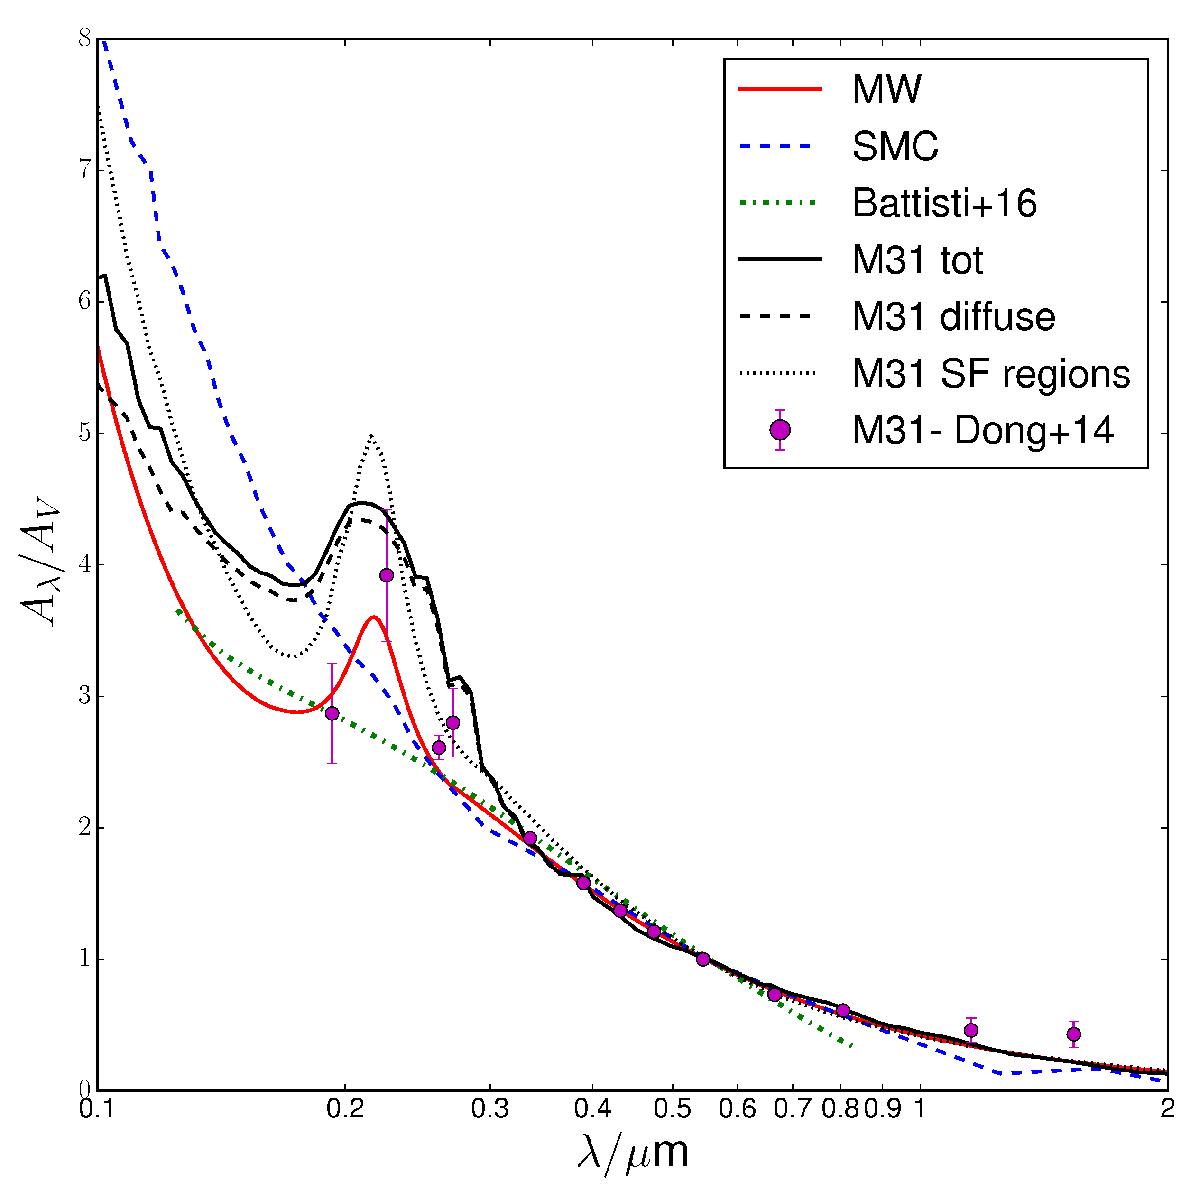
Attenuation laws from our model, normalised to the V-band attenuation. The black solid line is the global law. The dashed line reflects the attenuation law for the diffuse dust and the dotted black line for the dust in star-forming regions. Several literature measurements are shown; red curve: MW curve for R(V) = 3 from Fitzpatrick & Massa (2007), blue dashed line: SMC bar region (Gordon et al. 2003), and green dash-dotted line: attenuation curve from Battisti et al. (2016).
Current usage metrics show cumulative count of Article Views (full-text article views including HTML views, PDF and ePub downloads, according to the available data) and Abstracts Views on Vision4Press platform.
Data correspond to usage on the plateform after 2015. The current usage metrics is available 48-96 hours after online publication and is updated daily on week days.
Initial download of the metrics may take a while.