Fig. 10
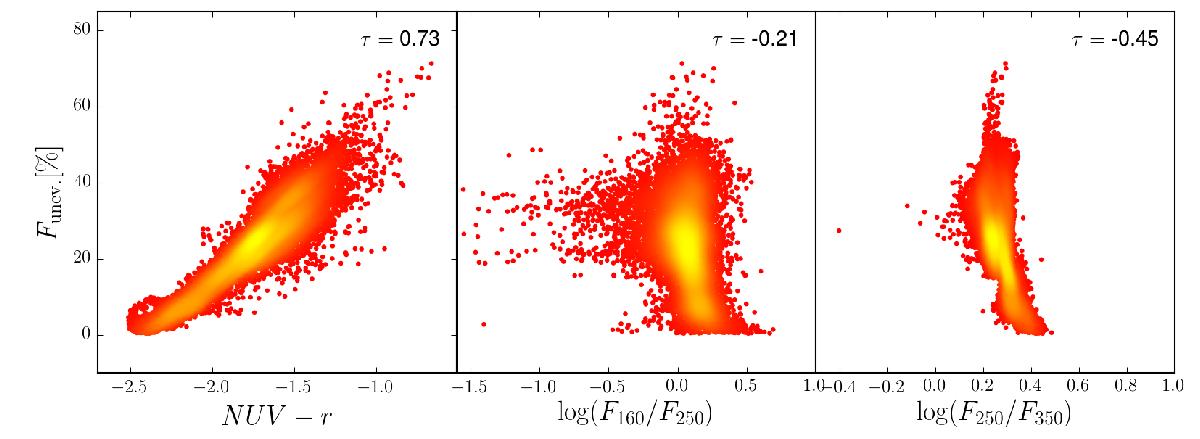
Density plots of the dust heating fraction from unevolved stellar populations Funev. vs. NUV−r and two commonly used FIR colours. Only pixels within a galactocentric radius of 18 kpc are shown. Kendall’s correlation coefficient τ is given in each panel. A red colour indicates a small number of data points in that area of the plot, yellow at a large number.
Current usage metrics show cumulative count of Article Views (full-text article views including HTML views, PDF and ePub downloads, according to the available data) and Abstracts Views on Vision4Press platform.
Data correspond to usage on the plateform after 2015. The current usage metrics is available 48-96 hours after online publication and is updated daily on week days.
Initial download of the metrics may take a while.