Fig. 1
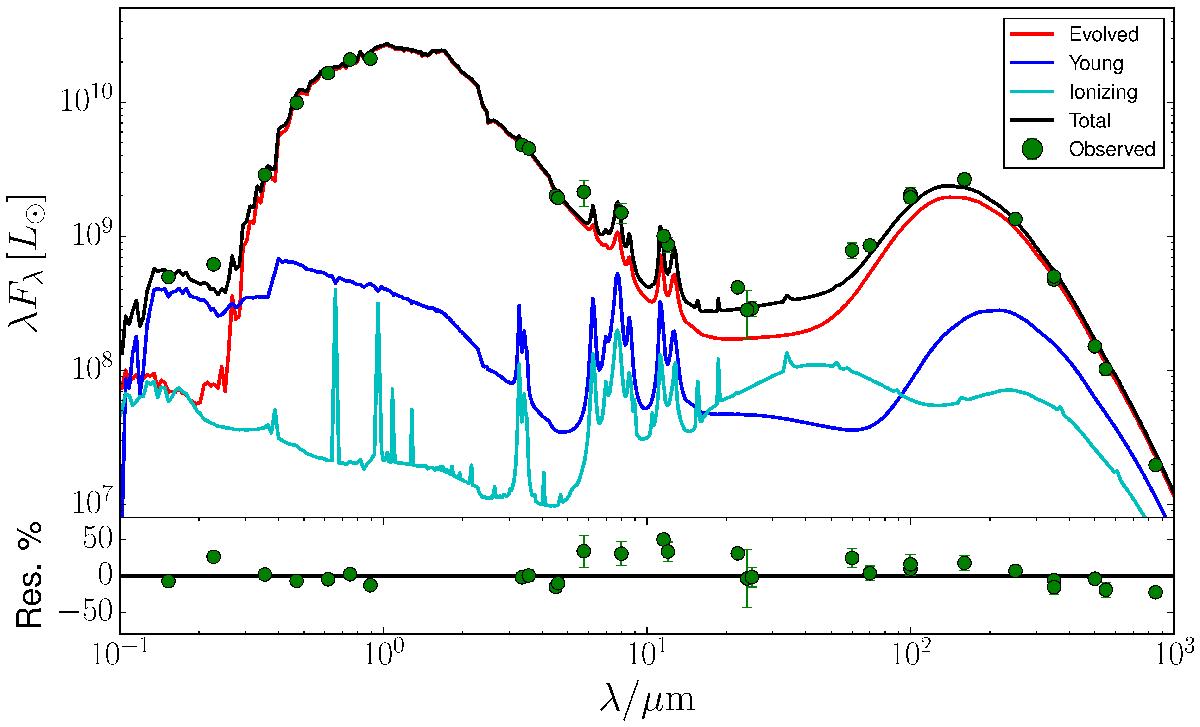
Panchromatic SED of Andromeda. The black line is the best fitting RT model, run at high resolution (512 wavelengths). The green points are the observed integrated luminosities for M 31. The red, blue and cyan lines represent the SEDs for simulations with only one stellar component: evolved, young and ionising, respectively. The interstellar dust component is still present in these simulations. The bottom panel shows the residuals between the observations and the best fitting (black) model.
Current usage metrics show cumulative count of Article Views (full-text article views including HTML views, PDF and ePub downloads, according to the available data) and Abstracts Views on Vision4Press platform.
Data correspond to usage on the plateform after 2015. The current usage metrics is available 48-96 hours after online publication and is updated daily on week days.
Initial download of the metrics may take a while.